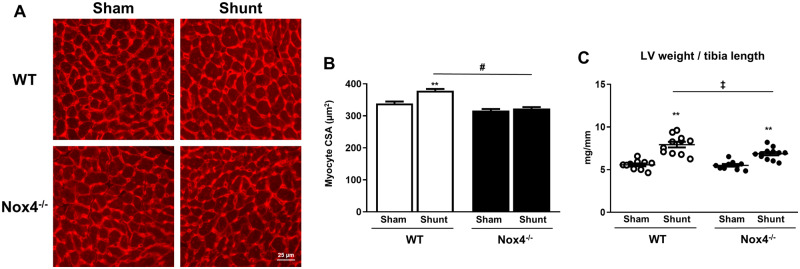
Figure 3.
Cardiac hypertrophy in Nox4−/− mice and WT littermates after volume overload. (A) Representative histological images showing LV myocardial sections stained with wheat germ agglutinin (WGA) after Shunt or Sham. (B) Myocyte cross-sectional area (CSA)—mean ± SEM for ≥350 cells and 6–7 hearts/group. (C) LV weight vs. tibia length (TL) ratio after Shunt or Sham (n = 10–12/group). **P < 0.01 for Shunt vs. Sham, ‡P < 0.05 between Shunt groups and significant interaction (P < 0.05) between genotypes, #P< 0.01 between Shunt groups and significant interaction (P < 0.01) between genotypes using two-way ANOVA followed by Bonferroni post-hoc test for multiple comparisons.

