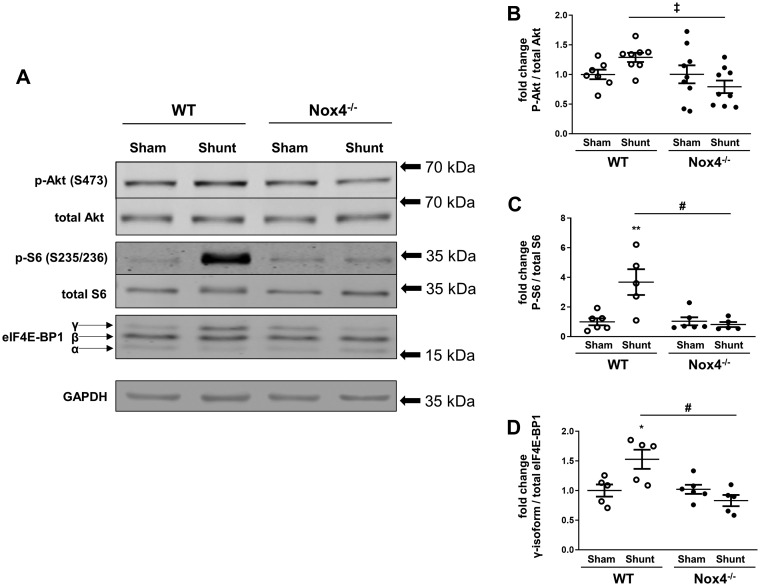
Figure 5.
Phosphorylation of Akt and downstream targets in Nox4−/− mice and WT littermates after volume overload. (A) Representative western blot images for phospho-Akt at Ser473 (p-Akt), total Akt, phospho-S6 ribosomal protein (p-S6), total S6 ribosomal protein, eIF4E-BP1 (eukaryotic translation initiation factor 4E-binding protein 1; divided into α, β, and γ-isoforms), and GAPDH as loading control in the LV after Shunt and Sham. (B–D) Mean data for phosphorylated vs. total Akt (B), phosphorylated vs. total S6 ribosomal protein (C), and the hyper-phosphorylated γ-isoform vs. total eIF4E-BP1 (D) using densitometry (n = 5–9/group). *P < 0.05, **P < 0.01 in Shunt vs. Sham, ‡P < 0.05 between Shunt groups and significant interaction (P < 0.05) between genotypes, #P < 0.01 between Shunt groups and significant interaction (P < 0.01) between genotypes using two-way ANOVA followed by Bonferroni post-hoc test for multiple comparisons.

