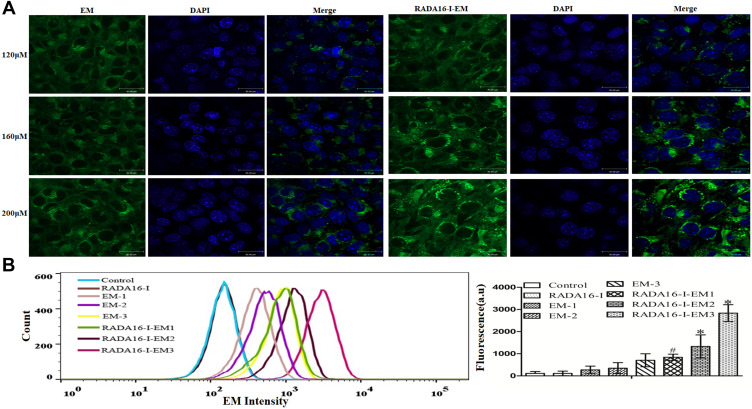
Figure 4.
(A) Confocal images of Hepa1-6 cells incubated with free EM (water suspension) and RADA16-I-EM hydrogels at 24 h. Blue and green colors represent DAPI and EM, respectively; Scale bars are 30 μm. [EM] = 120, 160, 200 μM. (B) Flow cytometry of uptake EM (left) and quantification (right) after 24 h incubation. The data were presented as the mean ± SD, n = 3. 1, 2 and 3 represent EM concentrations of 120, 160, 200 μM, respectively, [RADA16-I] = 5 mg/mL, #P<0.05, *P<0.01 vs free EM.

