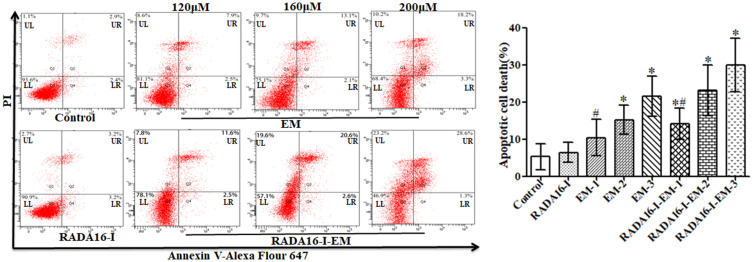
Figure 5.
Flow cytometry results for cancer cells. Percentage of apoptosis cells (Q2+Q4) were compared among groups. The data were presented as the mean ± SD, n = 3. 1, 2 and 3 represent EM concentrations of 120, 160, 200 μM, respectively, [RADA16-I] = 5 mg/mL, #P<0.05, *P<0.01 vs free EM or the control.
Abbreviations: LL, living cells; LR, early apoptotic cells; UL, necrotic cells; UR, late apoptotic cells.

