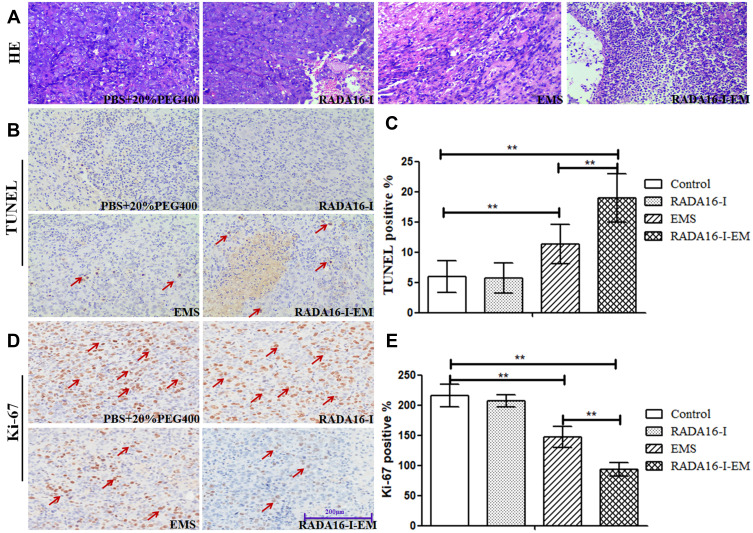
Figure 9.
Anti-tumor activity in xenograft models in vivo. (A) H&E, (B) TUNEL and (D) Ki-67 staining on tumor sections collected from Hepa1-6 tumor-bearing mice after various treatments, (C and E) represent the expression of TUNEL-positive cells and Ki67-positive cells, respectively. Data are expressed as the mean ± SD, n=4 for each group. **P < 0.01, EMS group and RADA16-I-EM group vs Control group, RADA16-I-EM group vs EMS group. The red arrows “↗” in figures (B and D) represent tumor cell apoptosis and proliferation, respectively.

