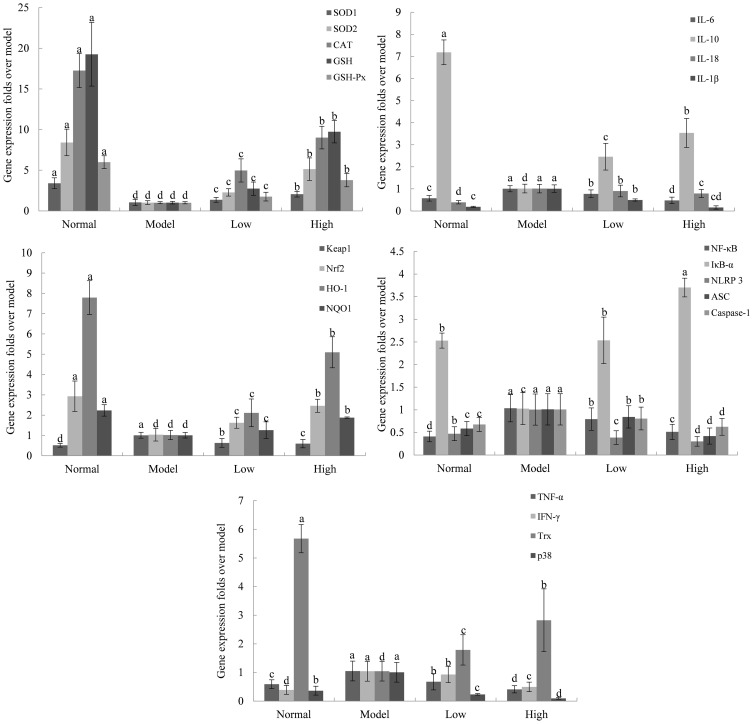
Figure 8.
Effects of Lactobacillus plantarum KSFY06 on the mRNA expression in liver tissue of mice. a–dThere was significant difference in different letters in the same column (P < 0.05), which was determined by Duncan’s multiple range test. Model: group induced by D-Gal/LPS (250 mg/kg·bw, 25 mg/kg·bw); Low: low-dose group, 2.5×10⁹ CFU/kg·bw; High: high-dose group, 2.5×10¹⁰ CFU/kg·bw.

