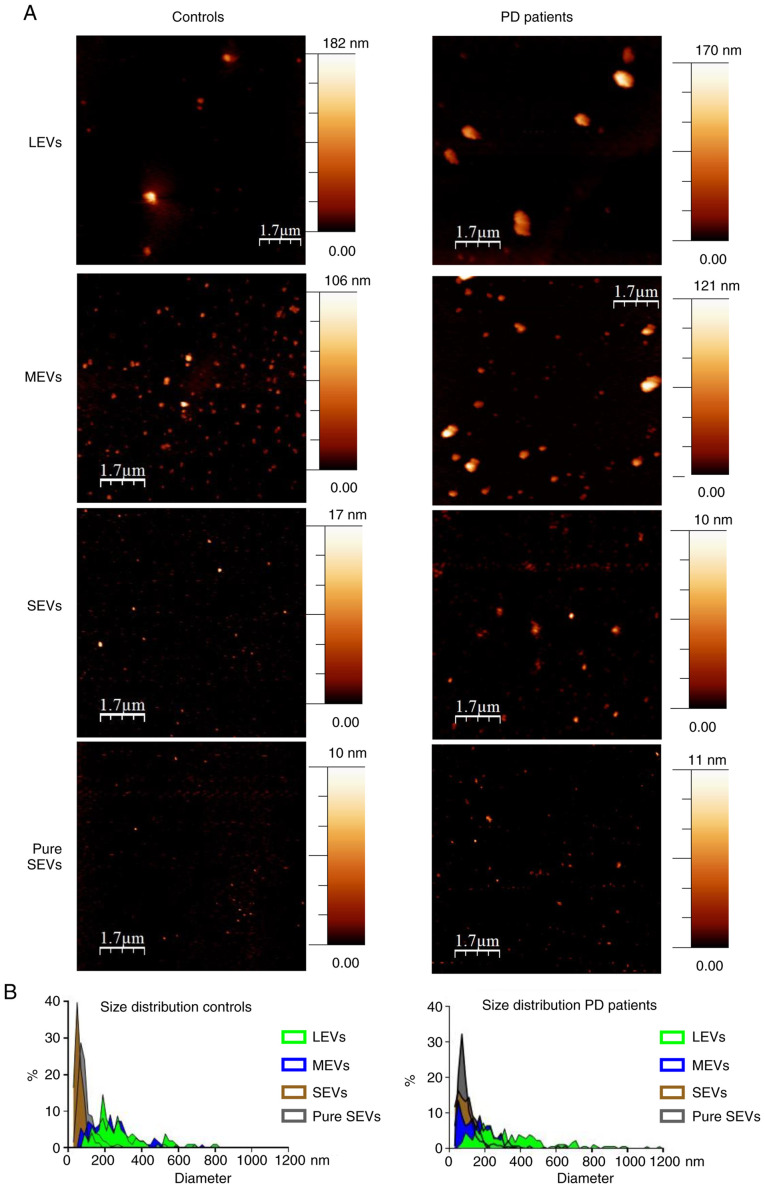
Figure 2.
Imaging of different EV preparations. (A) Atomic force microscopy (AFM) topography image of the LEVs, MEVs, SEVs and gradient fractions positive to EV markers (from 5 to 9, pure SEVs), preparations from controls and PD patients. Samples were adsorbed onto mica sheets, as mentioned in Materials and methods section (scale bar is indicated in each image; colorimetric scale, on the right of AFM images, indicates the maximum height detected in each image). (B) Size distribution obtained from analysis of AFM images such as in (A) A total of >500 objects (both for controls and PD patients) were analyzed for LEVs (green), MEVs (blue), SEVs (brown) and pure SEVs (grey) fractions. Numbers on graphs indicate the diameter (in nm), of each preparation from controls and PD patients respectively. LEVs, large extracellular vesicles; MEVs, medium extracellular vesicles; SEVs, small extracellular vesicles.

