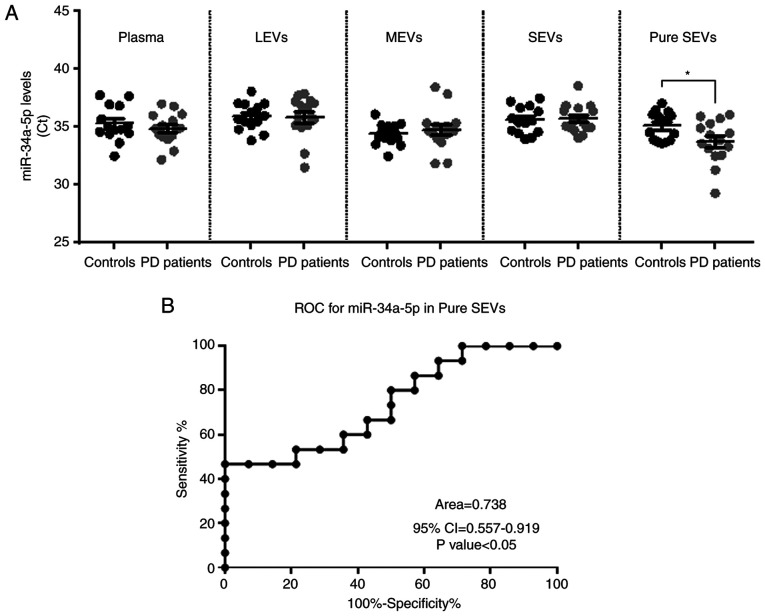
Figure 5.
Levels of miR-34a-5p in plasma and different EV types from either control subjects or PD patients. (A) Dot-plots show the miR-34a-5p Ct values determined by qPCR in plasma and plasmatic EVs for each subject (ncontrols=14; nPD patients=15); each dot represents a sample while largest bar represents the average ± SEM. miR-34a-5p levels were significantly higher in pure SEVs of PD patients compared to controls; *P<0.05 using unpaired t-test analysis. No significant differences were observed for plasma and in the other types of EVs. (B) ROC analysis for the ability of miR-34a-5p levels in pure SEVs to discriminate between control individuals and PD patients. LEVs, large extracellular vesicles; MEVs, medium extracellular vesicles; SEVs, small extracellular vesicles.

