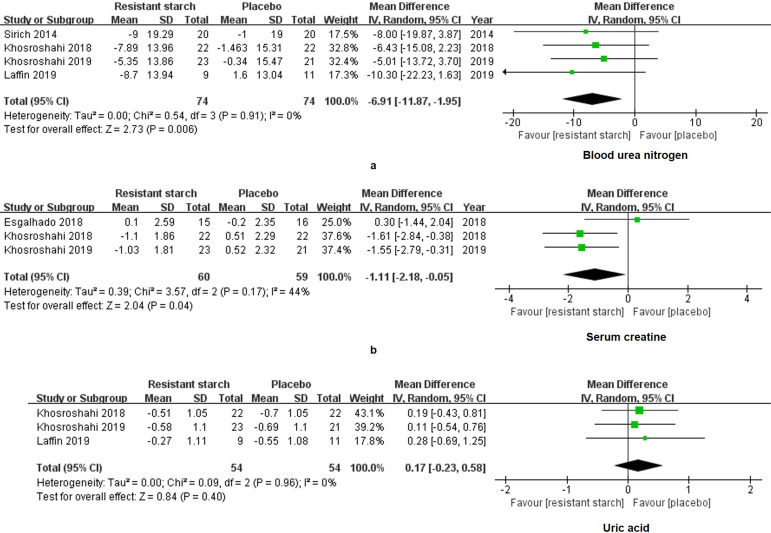
Figure 3.
Forest plots for comparisons of blood urea nitrogen (BUN), serum creatinine (Scr) and uric acid (UA). Data of BUN (a) in four studies including 148 subjects were analyzed. A significant decrease of BUN was shown in the resistant starch type 2 (RS2) group compared with the control group (WMD = -6.91, 95% CI, -11.87 to -1.95, I2 = 0%, P = 0.006). Scr (b) also showed a decrease in the RS2 group compared with the placebo in the meta-analysis (WMD = -7.43, 95% CI, -11.99 to -2.86, I2 = 44%, P = 0.001). However, no significant change of UA (c) has been displayed after RS2 treatment (WMD = 0.17, 95% CI, -0.23 to 0.58, I2 = 0%, P = 0.40).

