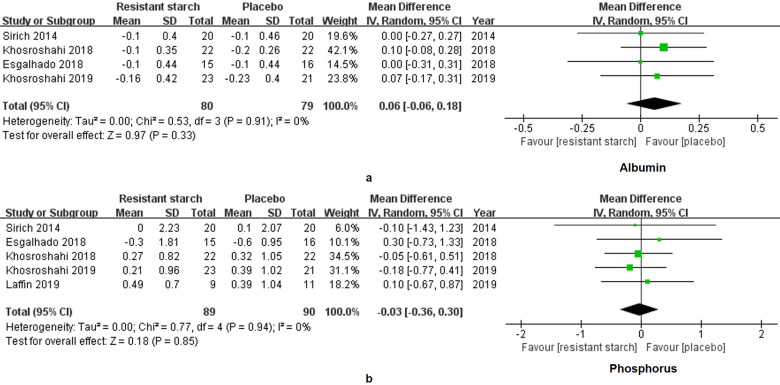
Figure 6.
Forest plots for comparisons of albumin and phosphorus in serum. Four studies including 159 subjects reported the data of albumin (a). Levels of albumin were insignificantly altered in the resistant starch 2 group as compared with the control group (WMD = 0.06, 95% CI, -0.06 to -0.18, I2 = 0%, P = 0.33). As for phosphorus (b), meta-analysis for five studies of 179 subjects showed insignificant change as well (WMD = -0.03, 95% CI, -0.36 to 0.30, I2 = 0%, P = 0.84).

