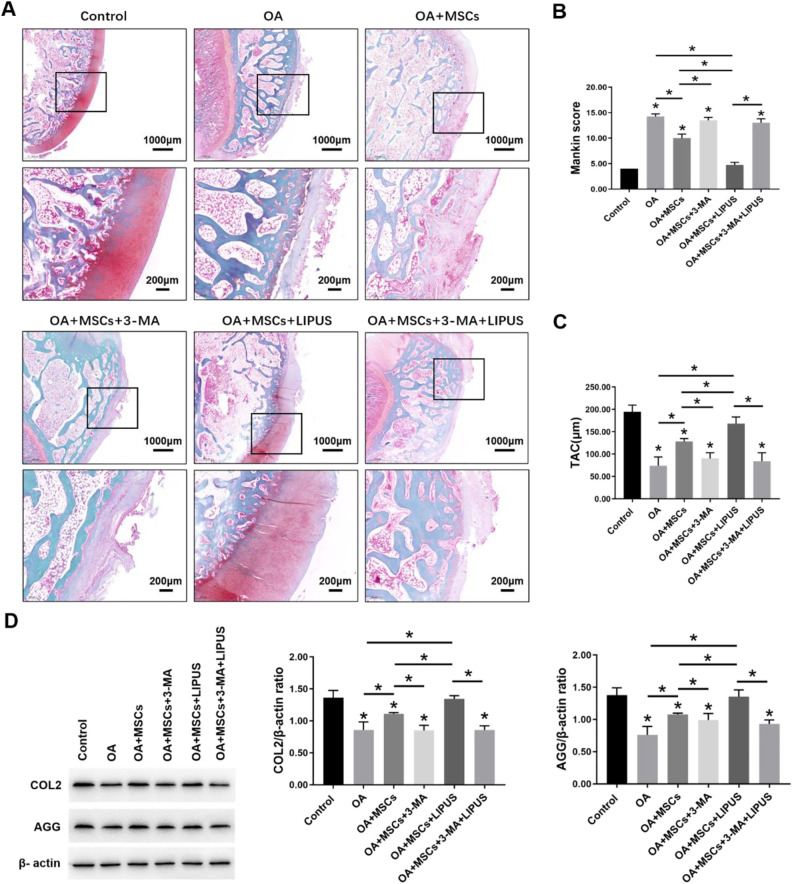
Figure 7.
Effects of LIPUS stimulation after intra-articular injection of MSCs on OA cartilage. (A) Morphological changes of cartilage revealed by safranin-O/fast green staining and observed under a microscope; scale bars = 1000 μm, 200 μm. (B) Bar graph comparing the Mankin scores. (C) Bar graph comparing the TAC thickness (μm). (D) Western blot analysis of COL2, AGG, and β-actin expression in cartilage. The values are the mean ± SD; n = 4, *P < 0.05. LIPUS: low-intensity pulsed ultrasound; MSC: mesenchymal stem cell; OA: osteoarthritis; TAC: total articular cartilage.

