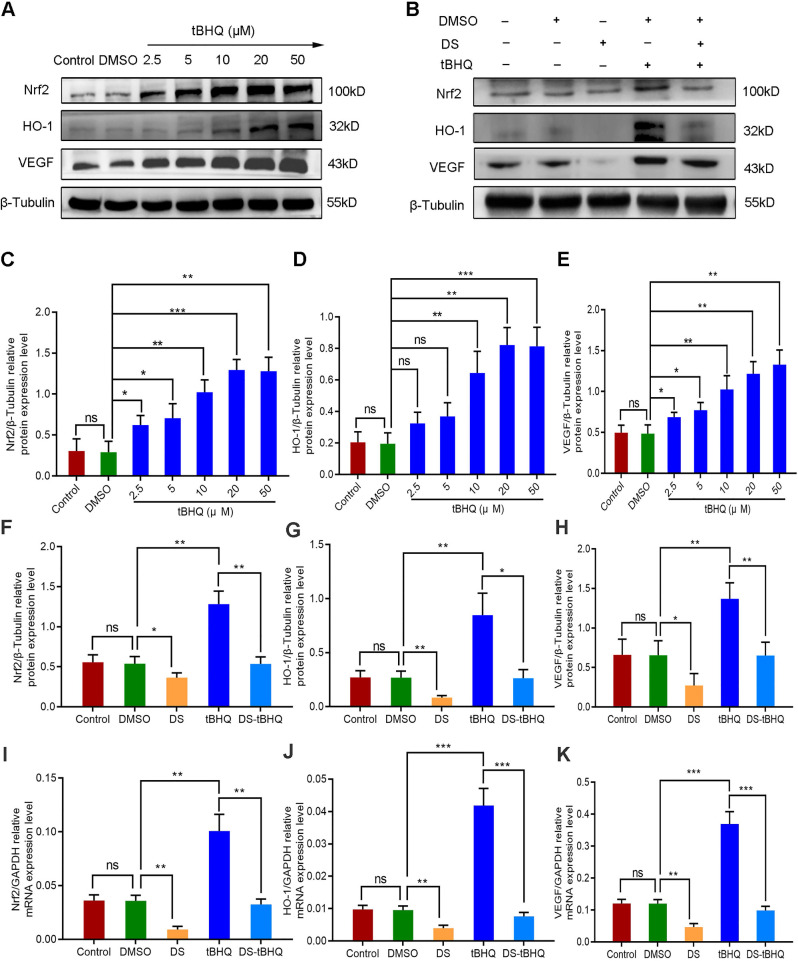
Figure 8.
Western blot (A-H) and qPCR (I-K) analyze the effects of DS, tBHQ and their combination on the protein and mRNA expression of Nrf2, HO-1 and VEGF in HGC-27 cells under hypoxic conditions. (A,C-E) HGC-27 cells were treated with a gradient concentration of tBHQ (0 µM, 2.5 µM, 5 µM, 10 µM, 20 µM, 50 µM) for 24 h. (B,F-K) HGC-27 cells were treated with untreated, 0.1% DMSO, 0.3% DS,10 µM tBHQ and 0.3% DS + 10µM tBHQ for 24 h, respectively. ns, no significance. * P <0.05, ** P <0.01, *** P < 0.001.

