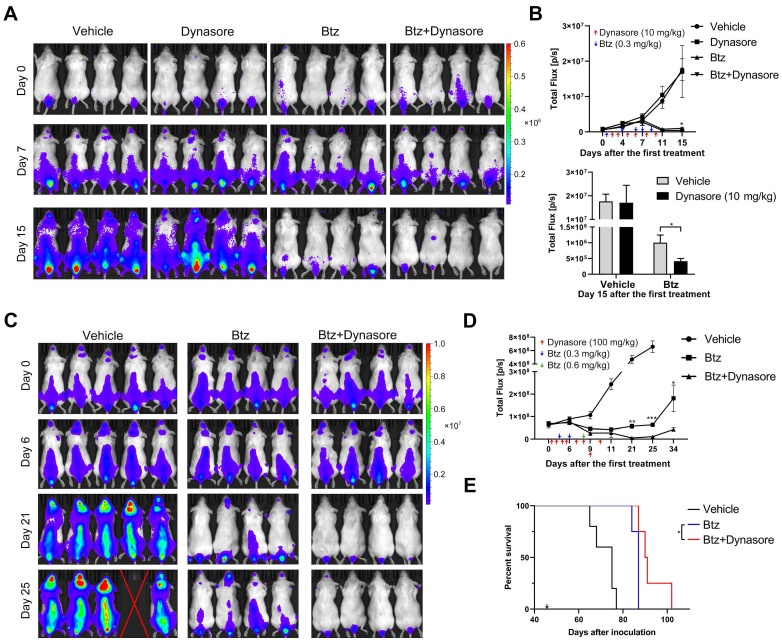
Figure 9.
Endocytosis inhibitor enhances the anti-MM effect of bortezomib in vivo and prolongs the survival of MM mice. (A) B-NDG mice inoculated with U266-GFP-Luc cells were treated with bortezomib (Btz) with or without dynasore. At day 2, 3, 5, 6, 7, and 9 after the first treatment, 10 mg/kg dynasore was intraperitoneally injected. 0.3 mg/kg bortezomib were intraperitoneally injected at day 1, 4, 6, 7, 9 after the first treatment. The distribution of MM cells in these mice was measured at the indicated days after the first treatment using a living imaging system. 4 representative mice per group are shown. (B) The total flux in each mouse after treatment for the indicated days was determined and presented (upper panel). Arrows indicate the doses and time points of treatments. The total flux in mice of all groups at day 15 after the first treatment was presented by histogram (lower panel). n (vehicle) =8, n (dynasore) =5, n (btz or btz+dynasore) =6. (C) B-NDG mice inoculated with U266-GFP-Luc cells were treated with bortezomib (Btz) with or without dynasore. At day 1, 2, 4, 5, 7, 8, 9, and 10 after the first treatment, 100 mg/kg dynasore were intraperitoneally injected. 0.3 mg/kg bortezomib were intraperitoneally injected at day 3 and 6 after the first treatment, and at day 8, 0.6 mg/kg bortezomib were intraperitoneally injected. The distribution of U266-GFP-Luc cells in these mice was measured at the indicated days after the first treatment using a living imaging system. (D) The total flux in each mouse after treatment for the indicated days was determined. Arrows indicate the doses and time points of treatments. n (vehicle) =5, n (btz or btz+dynasore) =4, Error bar, mean ± SEM. Student's t-test was used for comparing two groups. (E) Moribund mice with hindlimb paralysis were sacrificed and the Kaplan-Meier curve was established. Arrow indicates the day of the first treatment. *P < 0.05.

