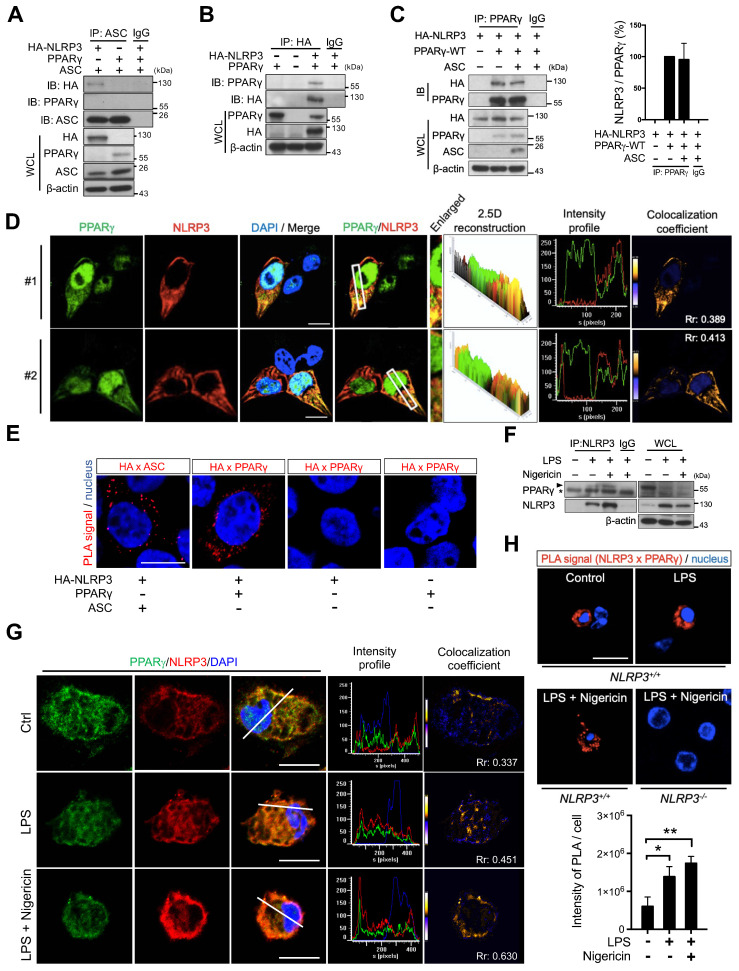
Figure 3.
PPARγ interacted with NLRP3 during NLRP3 inflammasome activation. (A) Immunoprecipitation and immunoblot analysis of the interaction between HA-tagged NLRP3, ASC, and PPARγ in HEK293T cells. (B) Immunoprecipitation and immunoblot analysis of the interaction between HA-tagged NLRP3 and PPARγ in HEK293T cells. (C) Immunoprecipitation and immunoblot analysis of the interaction between HA-tagged NLRP3 and PPARγ in presence of ASC in HEK293T cells. Quantification of HA-tagged NLRP3 relative to the level of PPARγ from three independent experiments. (D) Confocal images and co-localization analysis of HA-tagged NLRP3 (red) and PPARγ (green) in HEK293T cells. The enlarged images highlight the representative colocalization with 4× magnification from white squares in the overlay images. The 2.5-dimensional reconstruction analysis of the respective enlarged images is shown. The fluorescence intensity profile from green and red channels is shown. The colocalization coefficient is presented with yellow or blue color pixels indicate colocalization or segregation, respectively. Scale bar, 10 µm. (E) In situ proximity ligation assay (PLA) images for interaction between HA-tagged NLRP3 and PPARγ in HEK293T cells. Interaction between HA-tagged NLRP3 and ASC is performed as a positive control. The positive signals are represented by the fluorescent red dots. Scale bar, 10 µm. (F) Immunoprecipitation and immunoblot analysis of the interaction between NLRP3 and PPARγ in mouse peritoneal macrophages. PPARγ band is labeled with arrowhead and a non-specific band is labeled with asterisk. (G) Confocal images of NLRP3 (red) and PPARγ (green) in mouse peritoneal macrophages. The fluorescence intensity profile from green, red, and blue channels is shown. The colocalization coefficient is presented with yellow or blue color pixels for colocalization or segregation, respectively. Scale bar, 10 µm. (H) PLA images for interaction between NLRP3 and PPARγ in mouse peritoneal macrophages. Scale bar, 10 µm. The peritoneal macrophages from Nlrp3-/- mice are used as a control. Quantification of PLA signal per cell is presented. Pearson's coefficient (Rr) of the colocalization is shown in (D and G). *P < 0.05 and **P < 0.01 by one-way ANOVA with Fisher's LSD test. OE, overexpression; WCL, whole cell lysate; SN, supernatant. Representative blots in (B), (C), and (F) are from three independent experiments; and in (A) are from two independent experiments. Experiment replicates are shown in Figure S12.

