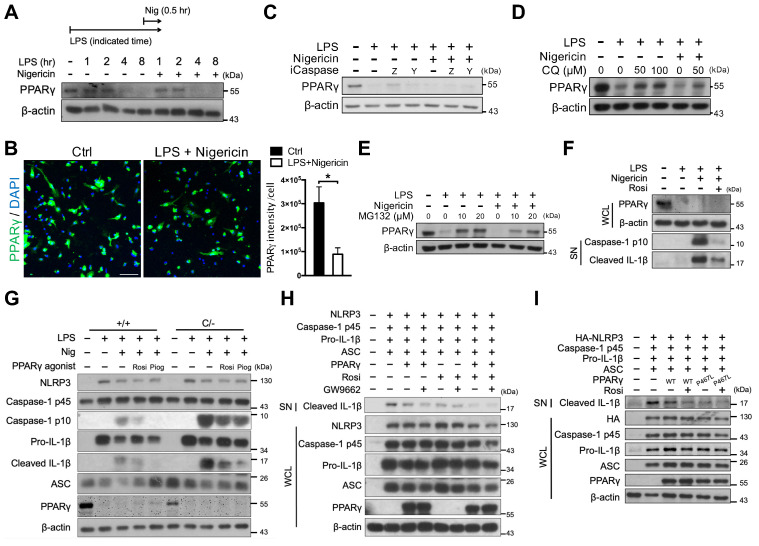
Figure 6.
Rosiglitazone attenuated NLRP3 inflammasome activation in a PPARγ-independent mechanism. (A) Immunoblot analysis of PPARγ in mouse peritoneal macrophages treated with LPS and nigericin for indicated time. A schematic diagram on the top shows the experimental design of LPS and nigericin treatment. (B) Immunofluorescent staining and quantification of PPARγ (green) intensity per cell in mouse peritoneal macrophages (n = 5 in each group). Scale bar, 50 µm. Negative controls are shown in Figure S4. (C-E) Immunoblot analysis of PPARγ in mouse peritoneal macrophages treated with (C) caspase-1 inhibitors (iCaspase; ZVAD (Z, 20 μM) and YVAD (Y, 20 μM)), (D) chloroquine (CQ), and (E) MG132. (F) Immunoblot analysis of PPARγ in whole cell lysate and caspase-1 activation and mature IL-1β in the supernatant in mouse peritoneal macrophages treated with rosiglitazone. (G) Immunoblot analysis of caspase-1 activation and IL-1β maturation in wild-type (Pparg+/+) and PpargC/- mouse peritoneal macrophages treated with rosiglitazone (Rosi, 20 μM) or pioglitazone (Piog, 20 μM) with Signal-2 exposure protocol. (H-I) Immunoblot analysis of mature IL-1β in the supernatant and indicated components and PPARγ in the cell lysates of NLRP3 inflammasome-reconstituted HEK293T cells transfected with indicated components and PPARγ (WT and P467L mutant). Rosiglitazone (Rosi, 20 μM) and GW9662 (20 μM) were treated for 24 h after transfection. *P < 0.05 by Student's t-test. WCL, whole cell lysate; SN, supernatant. Representative blots in (A), (E), (F), (H), and (I) are from three independent experiments; and in (C), (D), and (G) are from one experiment. Experiment replicates are shown in Figure S15.

