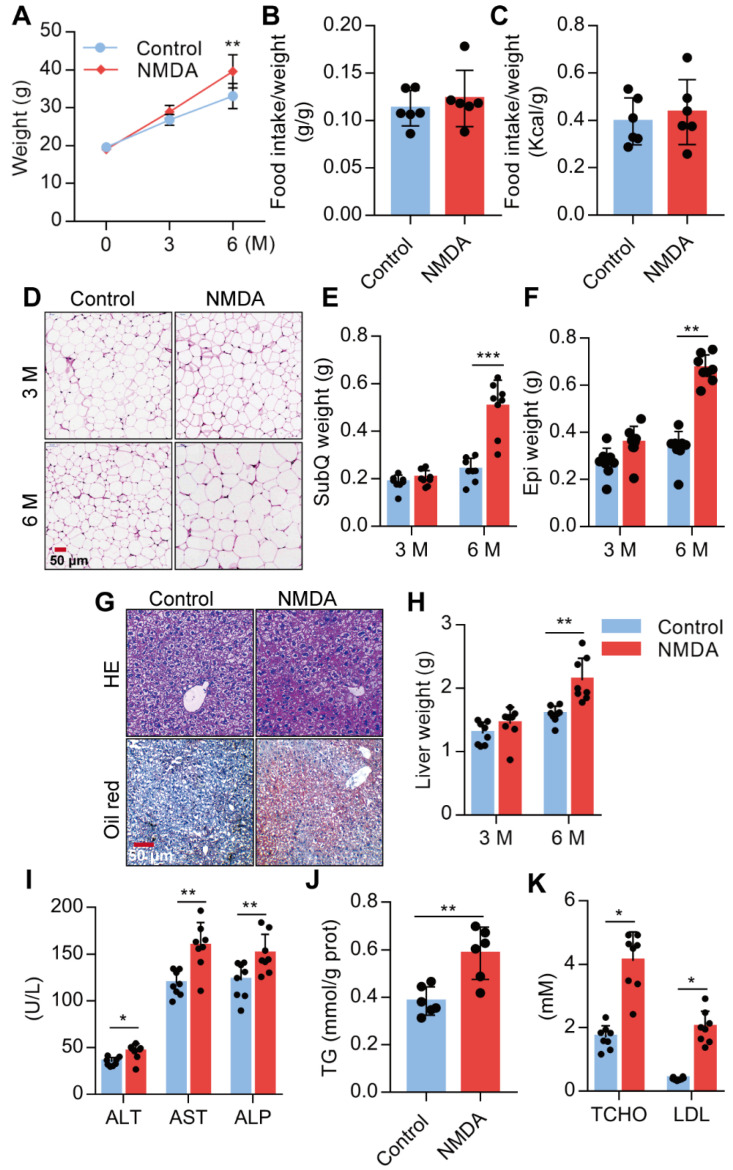
Figure 6.
Activation of NMDAR induces lipid accumulation in mice fed with a normal chow diet. (A) Growth curve of mice treated with NMDA for 3 months or 6 months (n = 12). (B-C) Determination of food intake of mice treated with NMDA for 6 months (n = 6). (D) H&E staining of SubQ from mice treated with NMDA for 3 months or 6 months (Scale bars = 50 μm). (E-F) Determination of SubQ and Epi weight from mice treated with NMDA for 3 months or 6 months (n = 8). (G) H&E stained histological images of liver sections from mice treated with NMDA for 6 months (Scale bars = 50 μm). (H) Determination of liver weight from mice treated with NMDA for 3 months or 6 months (n = 8). (I) Serum levels of ALT, AST, and ALP of mice treated with NMDA for 6 months (n = 8). (J) TG content in livers from mice treated with NMDA for 6 months (n = 6). (K) Serum levels of TCHO and LDL of mice treated with NMDA for 6 months (n = 8). *P < 0.05, **P < 0.01, ***P < 0.001. All data are presented as the mean ± SEM.

