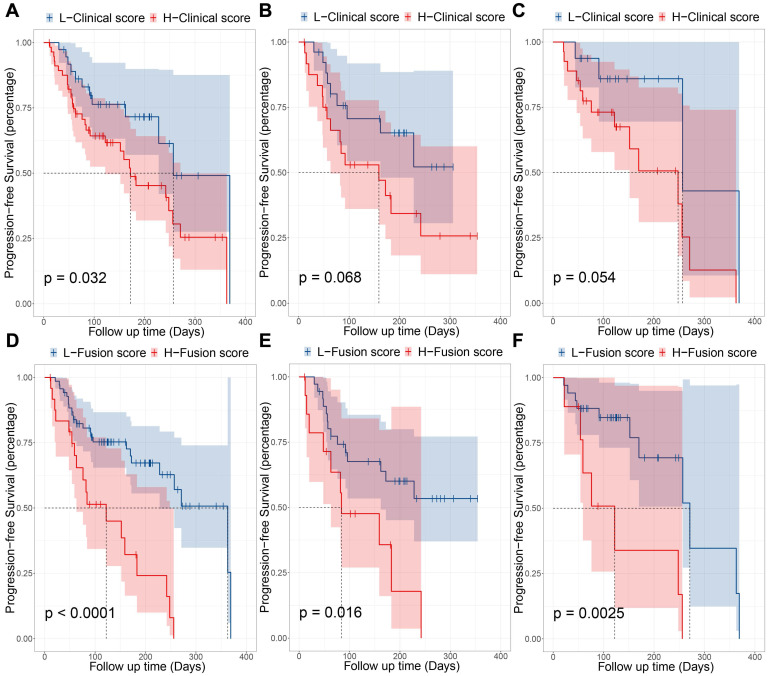
Figure 4.
Prognostic performance of clinical model and fusion model. (A, B and C) were the KM curves which indicated progression-free survival (PFS) of patients relative to clinical model in entire immunotherapy cohort, pembrolizumab-monotherapy group and pembrolizumab combined with chemotherapy group, respectively. (D, E and F) were the KM curves which indicated PFS of patients relative to combination of PD-L1 expression signature (PD-L1ES) and clinical model in entire immunotherapy cohort, pembrolizumab-monotherapy group and pembrolizumab combined with chemotherapy group, respectively.

