Figure 5.
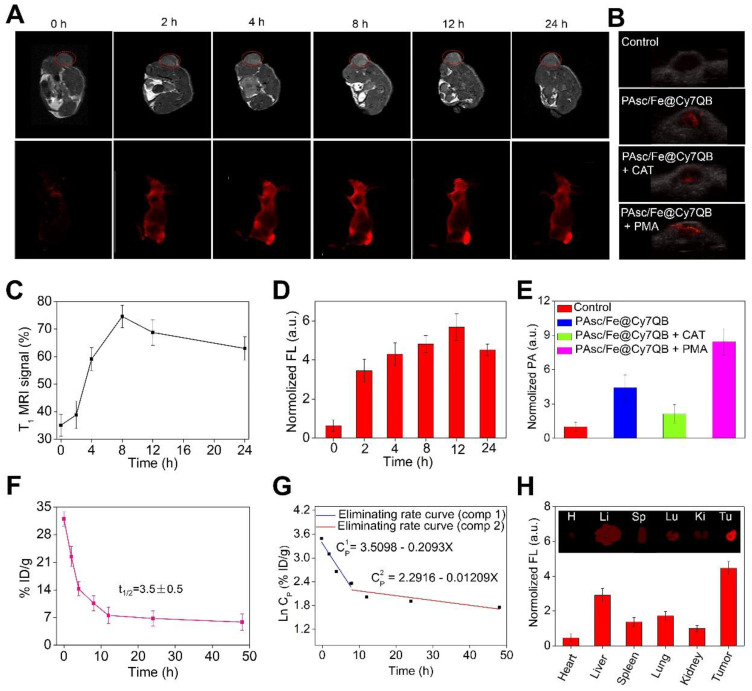
In vivo multimodal imaging. (A) In vivo MRI/FLI at 0, 2, 4, 8, 12, and 24 h i. v. post-injection of PAsc/Fe@Cy7QB (50 μg/mL, 100 μL). (B) PAI of each group at 12 h after PAsc/Fe@Cy7QB injection via the tail vein: PAsc/Fe@Cy7QB only; PAsc/Fe@Cy7QB + CAT; PAsc/Fe@Cy7QB + PMA. (C) Analysis of the tumor region by the MRI signals in (A). (D) Fluorescence intensity in mice after PAA/Fe@Cy7QB injection. (E) Analysis of the tumor region by the PAI signals in (B). (F) Blood level curve of PAsc/Fe@Cy7QB in mice fluorescence measurement of Cy7 in blood at different time points post i.v. injection. (G) Eliminating rate curve of injected PAsc/Fe@Cy7QB in blood circulation according to the Ln (concentration)-time relationship. The two stage eliminating rates of PAsc/Fe@Cy7QB are shown. (H) FLI of major organs and tumors of mice after 24 h i.v. injection PAsc/Fe@Cy7QB.

