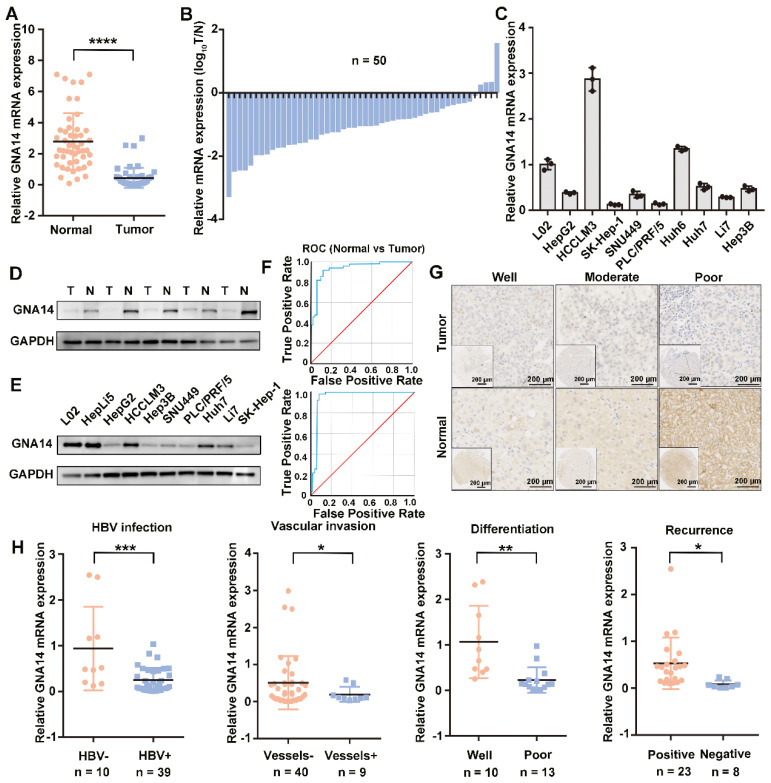
Figure 2.
GNA14 is downregulated in HCC. (A) qRT-PCR analysis of GNA14 mRNA level in tumor tissues and matched normal tissues from our hospital. (B) GNA14 mRNA level shown in log10(tumor/normal) form. (C) qRT-PCR analysis of GNA14 mRNA levels in HCC cell lines and L02 cells. (D, E) Western blot analysis of GNA14 protein levels in matched tumor tissues and normal tissues from our hospital and protein levels in HCC cell lines, L02 and HepLi5 cells. (F) ROC (receiver operating characteristic) curve in normal tissues and tumor tissues respectively in TCGA (AUC=0.948) and our hospital (AUC=0.935). (G) IHC staining analysis of GNA14 protein in matched tumor tissues and normal tissues. The expression levels of GNA14 in tumor tissues at different levels of differentiation (well-differentiated, moderate-differentiated, and poor-differentiated) are shown. (H) Relationship between GNA14 and the clinical characteristics. *p < 0.05, **p < 0.01, ***p < 0.001, ****p < 0.0001. Statistical significance was determined by unpaired t-test.

