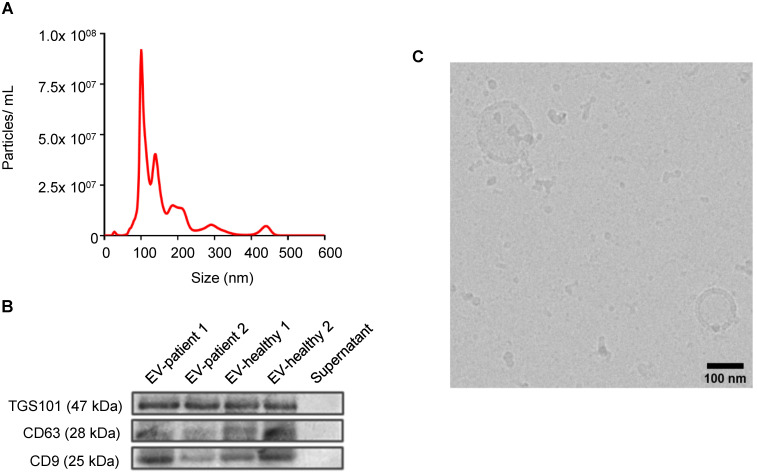
Figure 1.
Characterization of EVs from stage IV CRC patients. All CRC patient-derived EVs displayed similar shapes, size distributions, and EV-specific marker expression. (A) Representative particle size (relating to Patient 1) distribution analysis of plasma-derived EVs obtained by nanoparticle tracking analysis (NTA). (B) Expression analysis of EV marker proteins Tumor Susceptibility Gene-101 (TSG101) and tetraspanin proteins (CD63 and CD9) in plasma-derived EVs from patients or healthy donors. (C) Representative EV imaging (relating to Patient 1) by cryo-electron microscopy, scale bar: 100 nm. Additional images are shown in Supplementary Figure 1.

