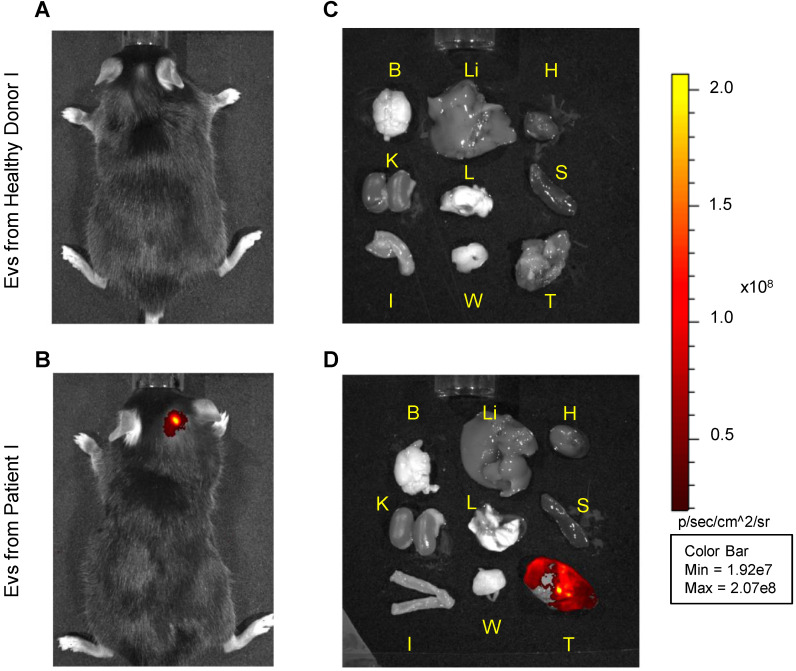
Figure 2.
Pseudocolor representative images of ICG fluorescence. In vivo (left panels) and ex vivo (right panels) imaging of MC-38 tumor-bearing mice injected with i) EVs obtained from a heathy volunteer (images A and C) or ii) patient-derived EVs, both labeled with ICG (images B and D). Images from other experiments are shown in Supplementary Figure S3. B: Brain, Li: Liver, H: Heart, K: Kidneys, L: Lungs, S: Spleen, I: Intestine, W: White Adipose Tissue, T: Tumor.

