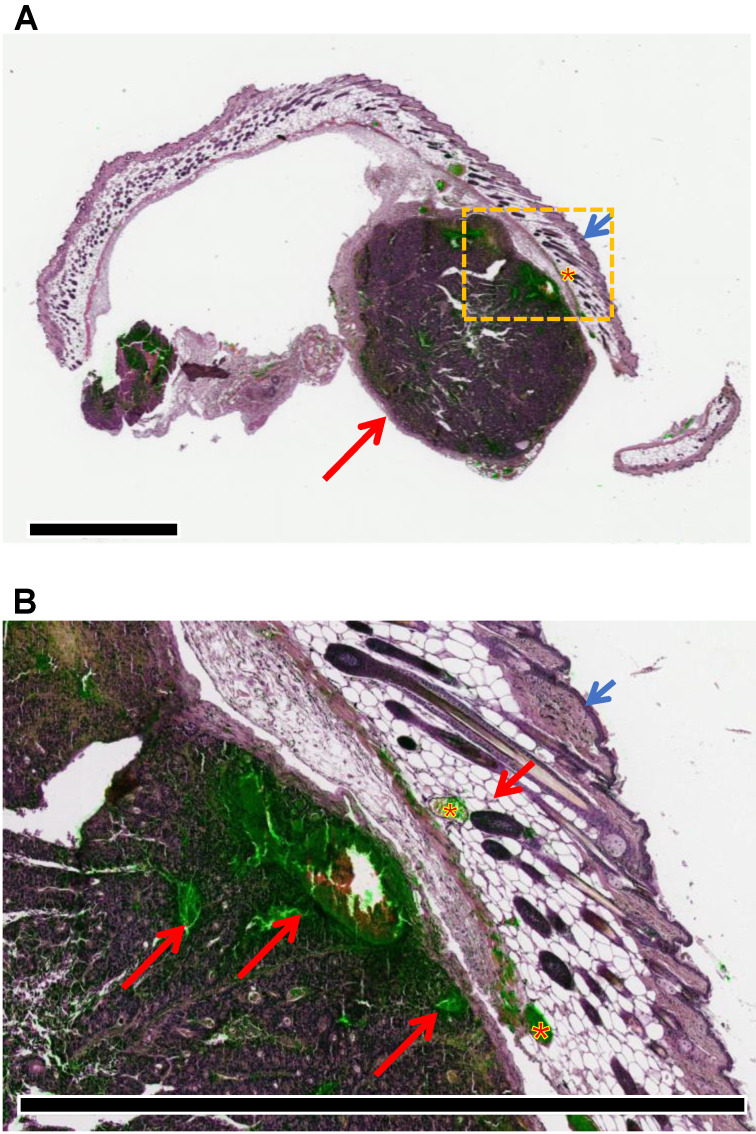
Figure 5.
Superposition of hematoxylin-eosin staining (violet) and ICG fluorescence (green) captured from adjacent sections shows the accumulation of fluorescence signals in the tumor tissue. (A) Macroscopic view of a representative sample with the tumor nodule located underneath the subcutaneous layer (short arrow: cutis; asterisk: subscutis; long arrow: tumor). Scale bar: 2 mm. (B) Details of the tumor tissue (long red arrow: ICG accumulation in cancer cells and tumor necrosis; asterisk: ipodermal vascular spaces; short blue arrow: cutis; short red arrow: subcutis). Scale bar: 2 mm.

