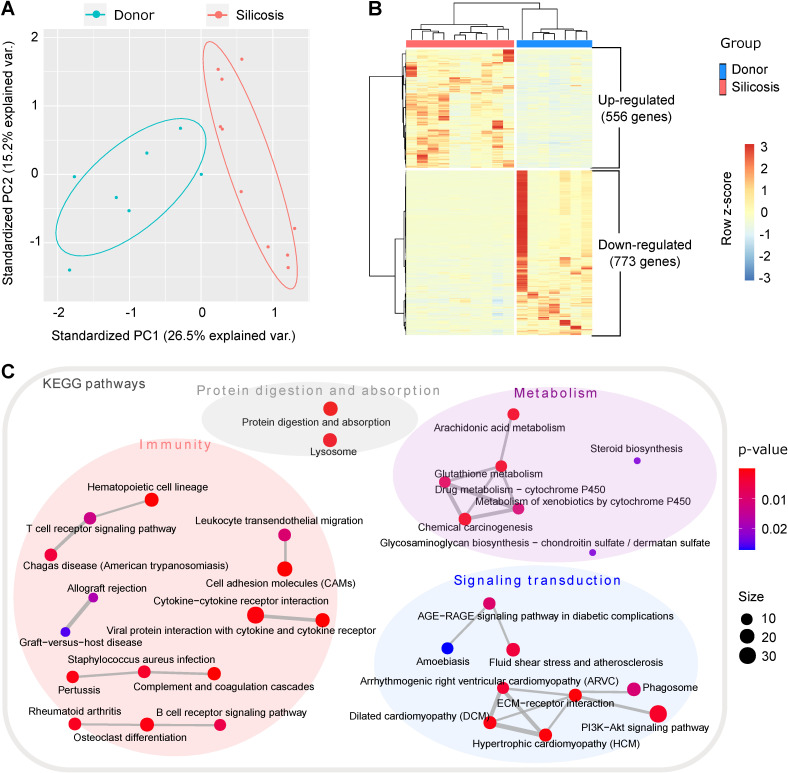
Figure 1.
Transcriptomics analysis of lungs from silicosis patients and healthy donors. (A) Principal component analysis of the samples. The red dots indicate lung samples from silicosis patients (n = 10) and the blue dots represent lung samples from healthy donors (n = 7). (B) Heatmap showing the differentially expressed genes between silicosis and healthy lungs. Each column represents a sample and each row a gene. The expression of genes was scaled using z-score. (C) Significantly enriched KEGG items of the differential genes. Four super classes were highlighted based on the nature of the pathways. KEGG, kyoto encyclopedia of genes and genomes.

