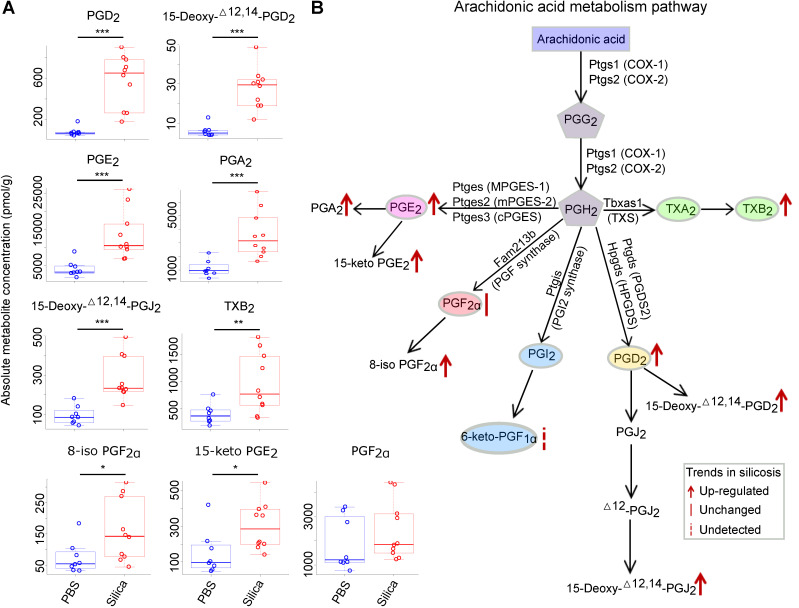
Figure 4.
Targeted metabolomics analysis of the arachidonic acid metabolism pathway using silicosis mouse lungs. (A) The absolute metabolite concentration of prostanoids and derivates in both PBS and Silica groups. The comparison between groups was analyzed using the two-tailed unpaired Student's t-test. *: p < 0.05; **: p < 0.01; ***: p < 0.001 are representative for the differences of the Silica group (n = 10) as compared to the PBS group (n = 8). (B) The diagram of arachidonic acid metabolism pathway and the metabolic changes in silicosis. PBS, phosphate-buffered saline.

