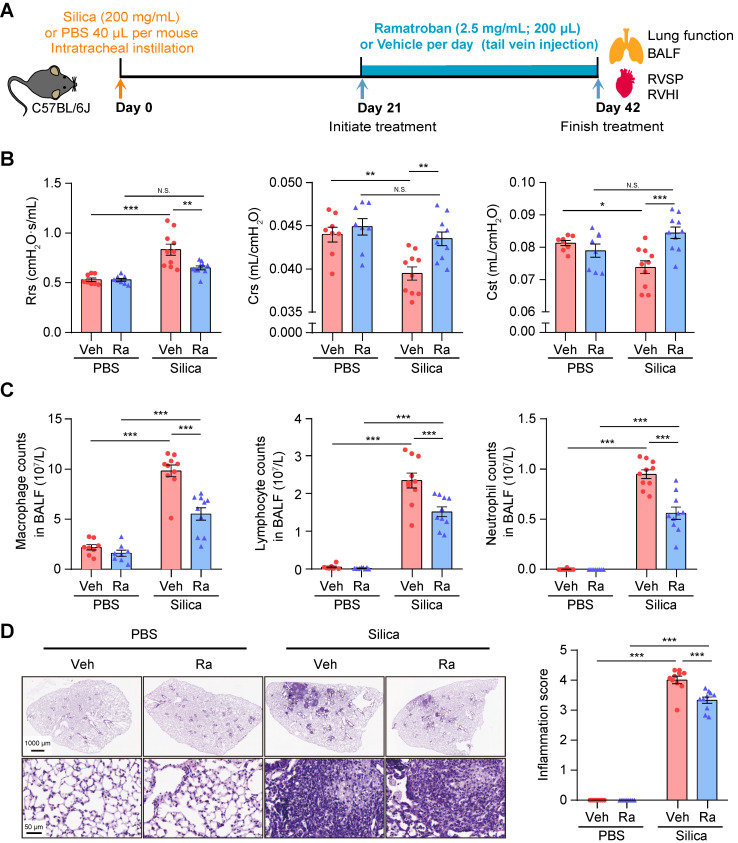
Figure 6.
Ramatroban treatment improved pulmonary function and inflammation in silicosis mice. (A) Schematic diagram of Ramatroban treatment on silicosis mice. (B) Measurements of parameters of pulmonary function, including Rrs, Crs, and Cst. (C) Counts of inflammatory cells (macrophages, lymphocytes, and neutrophils) in BALF. (D) Representative images of hematoxylin-eosin staining and quantification of pulmonary inflammation. Upper scale bar indicates 1000 μm, and lower scale bar indicates 50 μm. All the above experiments were performed at least three times. All the quantitative results are presented as mean ± SEM. The differences were analyzed by a two-way ANOVA and followed by Bonferroni adjustment. N.S.: no significance; *: p < 0.05, **: p < 0.01, and ***: p < 0.001. PBS group: n = 8 each group; Silica group: n = 10 each group. PBS, phosphate-buffered saline; BALF, bronchoalveolar lavage fluid; RVSP, right ventricular systolic pressure; RVHI, right ventricular hypertrophy index; Veh: vehicle; Ra: Ramatroban; Rrs, resistance; Crs, compliance of the respiratory system; Cst, quasi-static lung compliance.

