Figure 7.
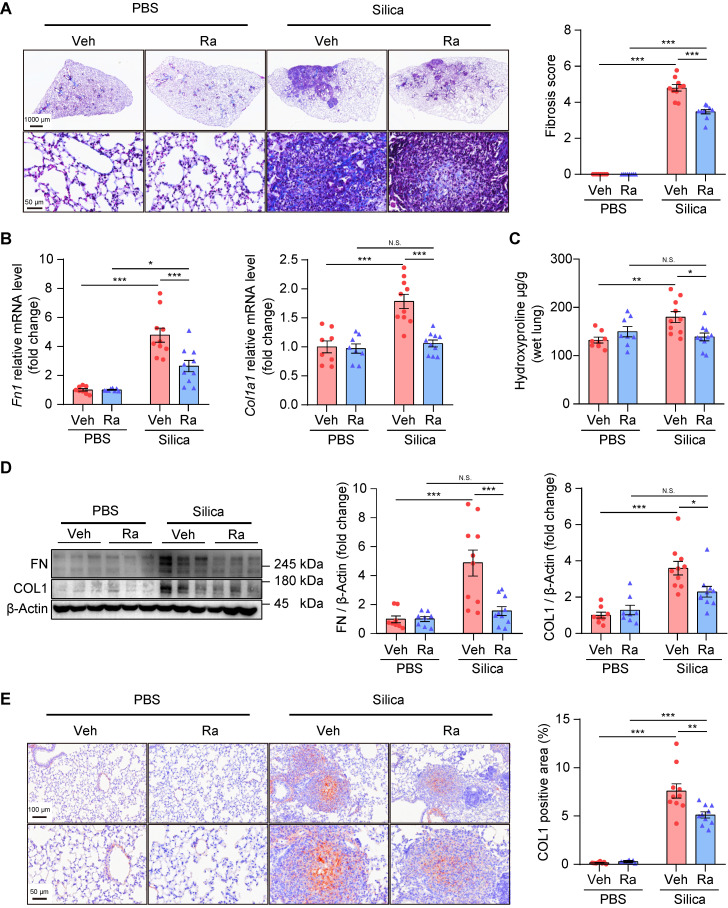
Ramatroban treatment alleviated pulmonary fibrosis in silicosis mice. (A) Representative images of Masson staining and quantification of pulmonary fibrosis. Upper scale bar indicates 1000 μm, while lower scale bar indicates 50 μm. (B) Relative mRNA expression levels of Fn1 and Col1a1. (C) Hydroxyproline levels evaluated from mouse lungs. (D) Representative western blotting images and quantification of FN and COL1. (E) Representative images of immunohistochemical staining and quantification of immunoreactivity of COL1 in lung sections. Red-brown indicates the positive staining. Upper scale bar indicates 100 μm, and lower scale bar indicates 50 μm. All the above experiments were performed at least three times. All the quantitative results are shown as mean ± SEM. The differences were calculated by a two-way ANOVA and followed by Bonferroni adjustment. N.S.: no significance; *: p < 0.05, **: p < 0.01, and ***: p < 0.001. Mouse lung tissues are from the Silica group (n = 10) or the PBS group (n = 8) following Ramatroban (Ra) or vehicle (Veh) treatment. Fn or FN, fibronectin; Col or COL, collagen; PBS, phosphate-buffered saline.

