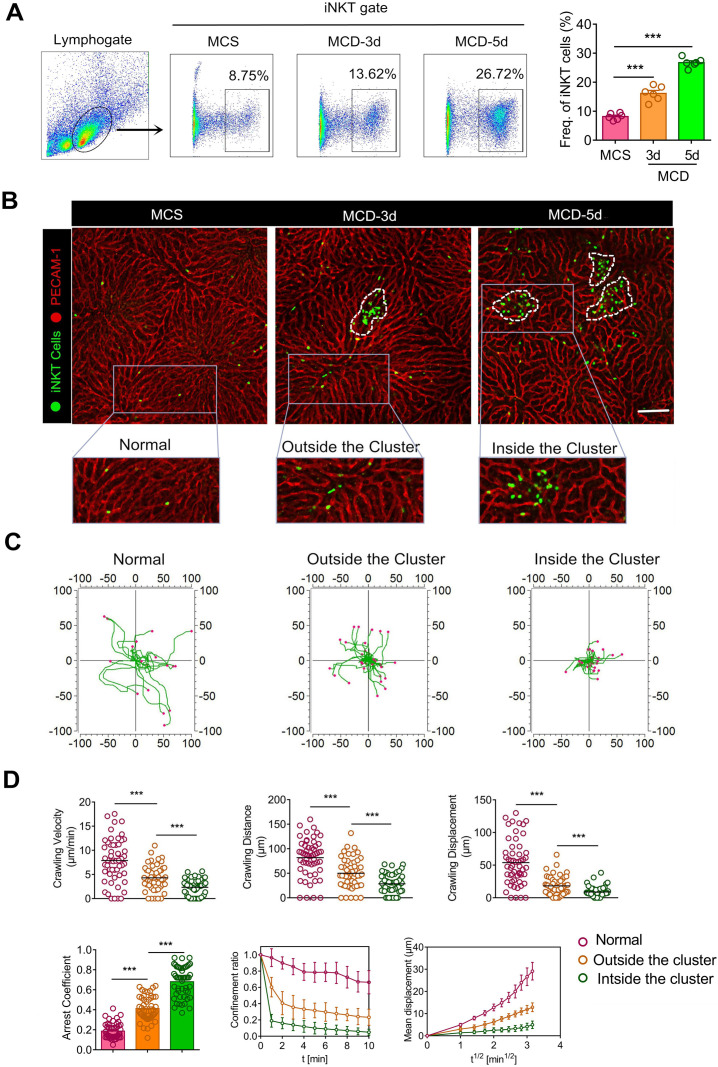
Figure 1.
Recruited iNKT cells form aggregated clusters and display distinct migratory patterns in early steatohepatitis. (A) Left: Frequencies of iNKT cells (GFP+CD1d-tetramers+) among liver leukocytes of C57BL/6 mice (n = 6) fed MCS or MCD diet for 3 or 5 days, as evaluated by flow cytometry. Right: Quantification of recruited iNKT cells in mice livers fed MCS or MCD diet for 3 or 5 days (n = 6). (B) Cxcr6Gfp/+ mice fed MCS or MCD diet for 3 or 5 days were subjected to hepatic intravital microscopy. Representative images were obtained from ≥ 3 independent experiments to examine iNKT cell response (green). The sinusoidal endothelium was labeled using Alexa Fluor 647-conjugated anti-platelet endothelial cell adhesion molecule (PECAM-1) antibodies (red). The image in the square with a gray outline is partially enlarged. iNKT cells were divided into three states: normal state, outside the cluster, and inside the cluster. Scale bar, 100 µm. iNKT cell clusters are indicated with a white dashed line. (C) Overlay of three states iNKT cell migratory tracks plotted after aligning their starting positions. Each plot was collected from 20 iNKT cells from three different Cxcr6Gfp/+ mice, and each scan was imaged for 10 min. (D) Scatter plots of the velocity, distance, and migratory displacement of migrating iNKT cells in the liver of Cxcr6Gfp/+mice (n = 3) fed MCS or MCD diet for 3 days. Scatter plots or displacement curves of the arrested coefficient, Confinement ratio, and mean displacement (µm) versus the square root of the time (min1/2) of migrating iNKT cells in the liver of Cxcr6Gfp/+ mice (n = 3) fed an MCS or MCD diet for 3 days. Fifty migrating iNKT cells from three independent experiments were pooled. Data represent mean relative expression ± SEM. *P < 0.05; **P < 0.01; ***P < 0.001 using two-tailed unpaired student's t-test.

