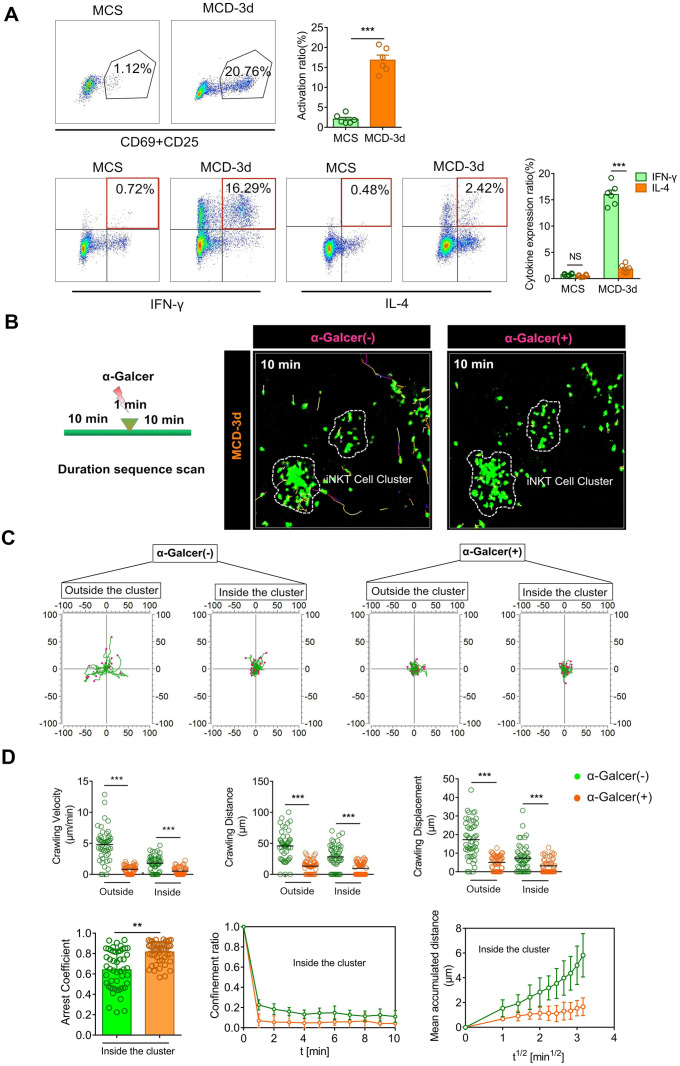
Figure 2.
iNKT cell clusters exhibit an activation pattern different from the classical α-GalCer stimulation. (A) Top: Representative flow cytometry image from three experiments of CD69 and CD25 expression of iNKT cells (GFP + CD1d-tetramer) obtained from Cxcr6Gfp/+mice (n = 6) fed MCS or MCD diet. Bottom: Representative flow cytometry image from three experiments of intracellular IFN-γ or IL-4 staining of iNKT cells (GFP + CD1d-tetramer) in Cxcr6Gfp/+ mice (n = 6) fed MCS or MCD diet. (B) Representative images showing the migratory paths of iNKT cells in Cxcr6Gfp/+ mice (n = 5) before and after treatment with α-GalCer. Each area was imaged for 10 min. Scale bar, 100 µm. (C) Alignment of the starting position of the iNKT cell migratory trajectory, covered before and after iNKT cell activation. Data were collected from three mice, and each scan was imaged for 10 mins. (D) Velocities, distance, and displacement of migrating iNKT cells in Cxcr6Gfp/+ mice (n = 3), before and after α-GalCer treatment. Scatter plots or displacement curves of the arrested coefficient, confinement ratio, and mean displacement (µm) versus the square root of the time (min1/2) of migrating iNKT cells in the iNKT clusters before and after α-GalCer treatment. Fifty iNKT cells from 3 independent experiments were pooled. Data represent mean relative expression ± SEM. *P < 0.05; **P < 0.01; ***P < 0.001 using two-tailed unpaired student's t-test.

