Figure 3.
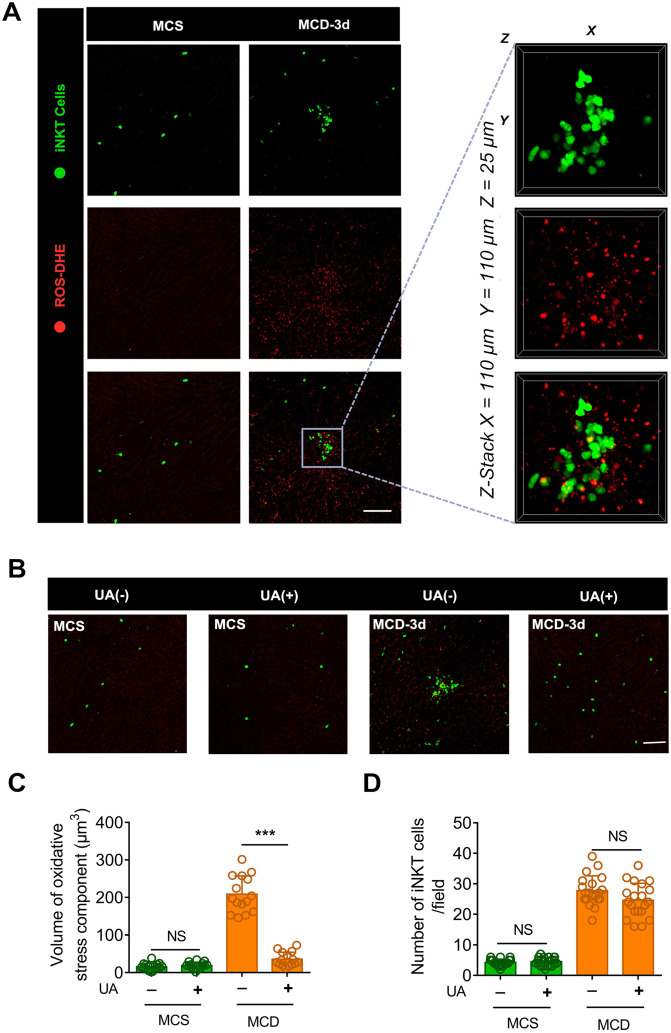
Uric acid (UA) blocks the aggregation of iNKT cells in necrotic inflammatory lesion areas. (A) Representative images from ≥ 3 independent experiments in Cxcr6Gfp/+mice fed MCS or MCD diet for 3 days. Reactive oxygen species (ROS) were labeled using the fluorescent probe dihydroethidium (DHE, red). The image in the square with a gray outline is partially enlarged. Representative 3D images showing DHE-labeled ROS in an iNKT cell cluster (green). Three-dimensional image dimensions, X = 110 µm, Y = 110 µm, Z = 25 µm, where the XY plane is perpendicular to the objective lens. (B) Representative images from ≥ 3 independent experiments to examine the number of recruited iNKT cells (green) in the liver of mice fed MCS or MCD diet for 3 days, with or without NAC treatment. ROS were labeled with DHE (red), Scale bar, 100 µm. (C) Quantification of the volume of oxidative stress debris in Cxcr6Gfp/+mice (n = 5) treated with or without UA. (D) Quantification of the number of liver iNKT cells in Cxcr6Gfp/+ mice (n = 5) treated with or without UA. Data represent mean relative expression ± SEM. *P < 0.05; **P < 0.01; ***P < 0.001 using two-tailed unpaired student's t-test.

