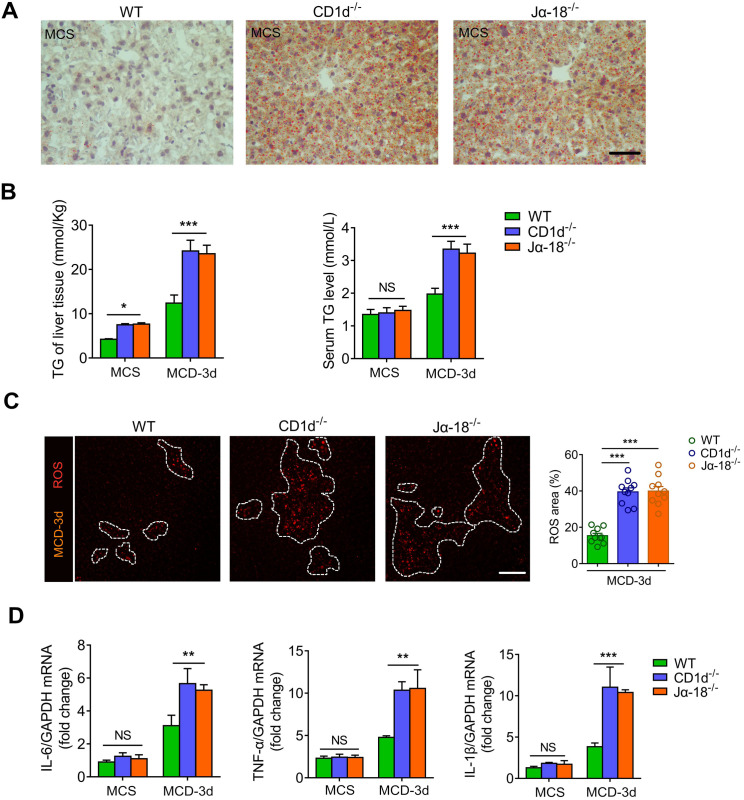
Figure 7.
iNKT cell defect results in lipid metabolic disorder and exacerbates steatohepatitis. (A) Representative image of Oil Red O staining illustrating TG accumulation in liver tissues from WT, CD1d-/-, Jα18-/- mice fed MCS diet. Scale bar, 100 µm. (B) Quantitative analysis of intrahepatic TG concentrations and serum TG levels in WT, CD1d-/-, Jα18-/- mice (n = 5) fed MCS or MCD diet for 3 days. (C) Left: Representative images from ≥ 3 independent experiments intravital imaging snapshots of ROS (red) area (indicated with a white dashed line) in WT, CD1d-/-, Jα18-/- mice fed MCD diet for 3 days. Scale bar, 100 µm. Right: Quantitative analysis of ROS area in WT, CD1d-/-, and Jα18-/- mice (n = 10) fed MCD diet for 3 days. (D) mRNA levels of inflammatory cytokines Il-6, Tnf-α, and Il-1β in liver tissues of WT, CD1d-/-, and Jα18-/- mice (n = 5) fed an MCS or MCD diet for 3 days. Data represent mean relative expression ± SEM. *P < 0.05; **P < 0.01; ***P < 0.001 using two-tailed unpaired student's t-test.

