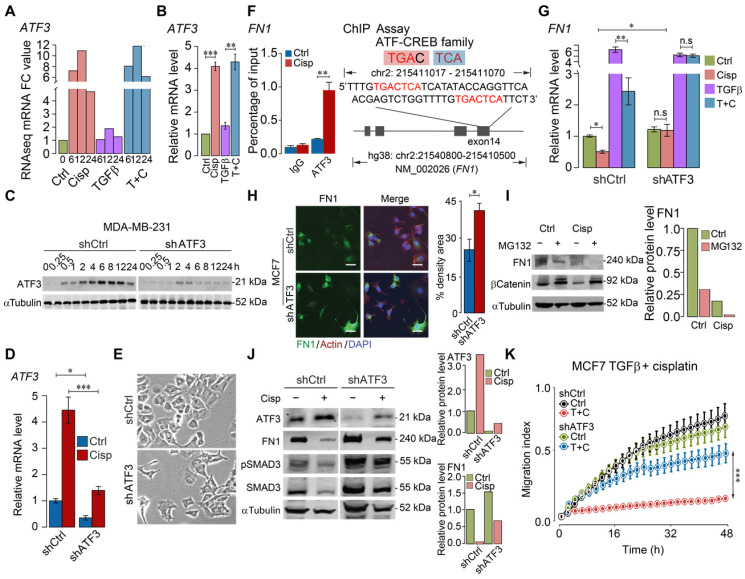
Figure 4.
ATF3 stimulation by cisplatin suppresses FN1 transcription and hence compromises cell migration. A, B ATF3 expression was significantly induced by cisplatin but not affected by TGFβ revealed by RNA-seq (A) and confirmed by RT-qPCR (B) in MDA-MB-231 cells, FC (Fold Change). C-E Cisplatin induces ATF3 expression, which was diminished in ATF3-KD cells at protein (C) and RNA (D) levels. Also, ATF3-KD cells prevailed spindle cell phenotype (E). F ChIP-seq showed that ATF3 binds to exon 14 of FN1, which is enhanced by cisplatin treatment. The binding site was shown on the right panel. G Cisplatin reduces FN1 expression in both control and TGFβ treated cells, which is blocked by the knockdown of ATF3. H Knockdown of ATF3 increased FN1 expression revealed in immunofluorescent staining of FN1 and merged with Actin and DAPI. Quantification of FN1 levels was shown on the right panel. Bar = 50 μm. I Western blot analysis of FN1 expression under ubiquitin-proteasome inhibitor, MG132, to determine if FN degradation requires proteasome-mediated protein degradation in control cells and cisplatin treated cells. J Cisplatin induces ATF3, reduces FN1 and pSMAD3, which is attenuated by knockdown of ATF3. Quantification of ATF3 and FN1 levels was shown on the right panels. K ATF3 knockdown did not affect cell migration but significantly attenuated inhibition of cisplatin on cell migration induced by TGFβ treatment. In (B, D, F, G, H and K), data represent means ± standard deviations (SDs). See also Figure S5. Concentration of drugs in this figure: TGFβ [5 ng/mL] cisplatin [10 μM]. Immunoblots shown in this figure have 3 replicates. ns, *, ** and *** means not significant, p < 0.05, p < 0.005, and p < 0.0005, respectively.

