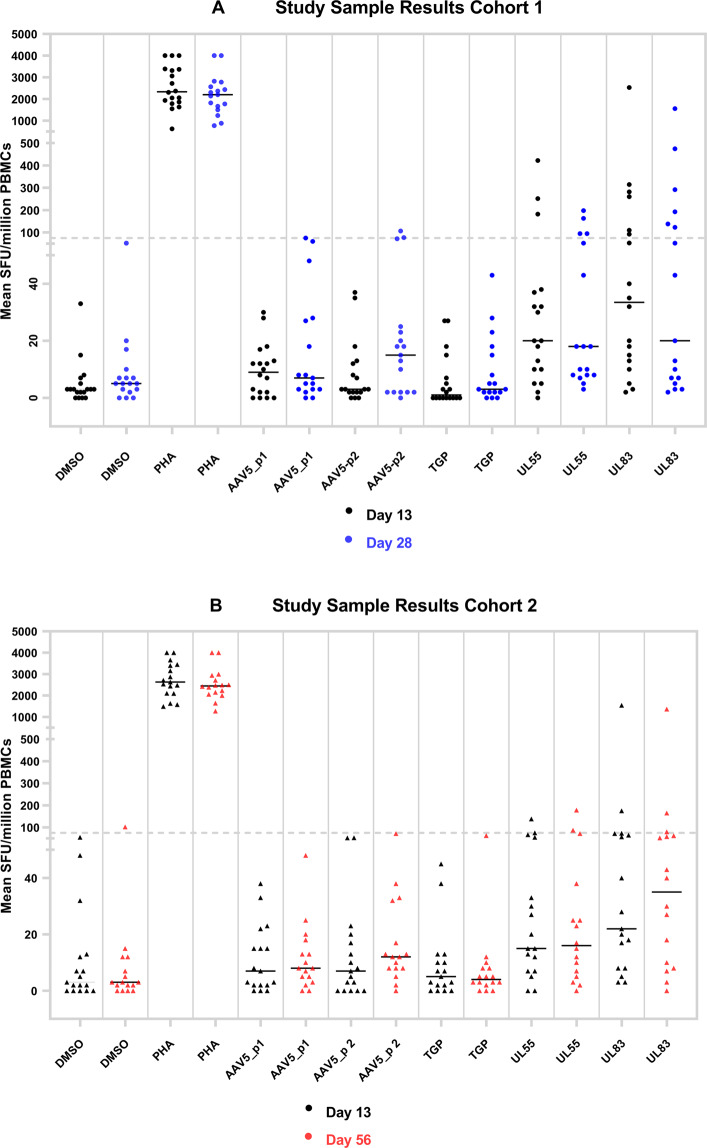
Fig. 4. Graphical summary of cellular immune responses in study animals.
PBMCs collected after AAV5 gene therapy adminstration were left unstimulated (mock) or stimulated with various peptide pools or PHA and tested in INFγ ELISpot. Respones were expressed as SFU/million PBMCs. A Cohort 1: PBMCs from 18 animals collected on Day 13 (black dots) and 28 (blue dots) after AAV5 gene transfer. B Cohort 2: PBMC samples from 18 animals collected on Day 13 (black dots) and 56 (red dots) after AAV5 gene transfer. PHA responses reported ‘as too many to count’ (TNTC) were imputed as 4000 SFU/million PBMC for graphical purposes.

