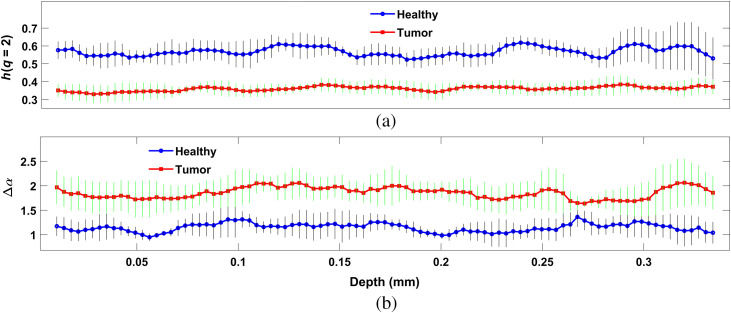
Fig. 5.
Overall multifractality in dominant submicron structure over en face images at different tissue depths at 10 different areas of the tissue sample. (a) Hurst exponent [] represents correlation of submicron structural distribution over en face for healthy (blue) and tumor (red) tissue at different depths. (b) The width of singularity spectrum () represents randomness of submicron structures over en face images at different depths for healthy (blue) and tumor (red) tissue. Vertical black lines, and vertical green lines are standard deviations at each depth.

