Figure 4.
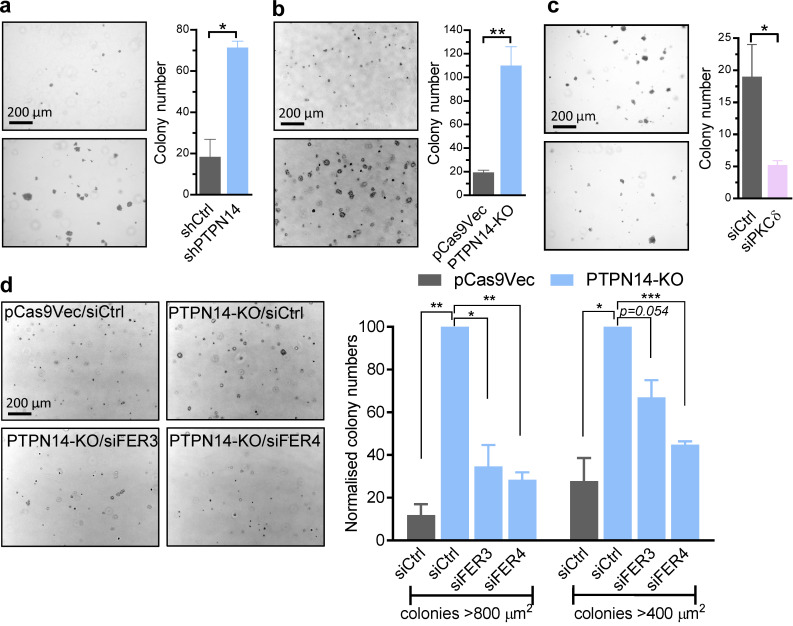
PKCδ and FER enhance cancer cell growth downstream of EGFR activation. (a–d) Colony-forming potential of breast cancer cell lines in the presence of EGF (20 ng/ml), showing representative micrographs of colonies (left) and quantified data (right) of control (shCtrl) or PTPN14 knockdown (shPTPN14) MDA-MB-231(LM2) cells (day 16 colonies, n = 2; a), pCas9Vec or PTPN14-KO BT-549 cells (day 7 colonies, n = 3; b), BT-549 cells transfected with control (siCtrl) or PKCδ (siPKCδ) siRNA (day 8 colonies, n = 3; c), and pCas9Vec or PTPN14-KO BT-549 cells transiently transfected with siCtrl, siFER3, or siFER4 (day 7 colonies, n = 3; d; mean ± SEM; *, P < 0.05; **, P < 0.01; ***, P < 0.001 using Student’s t test).

