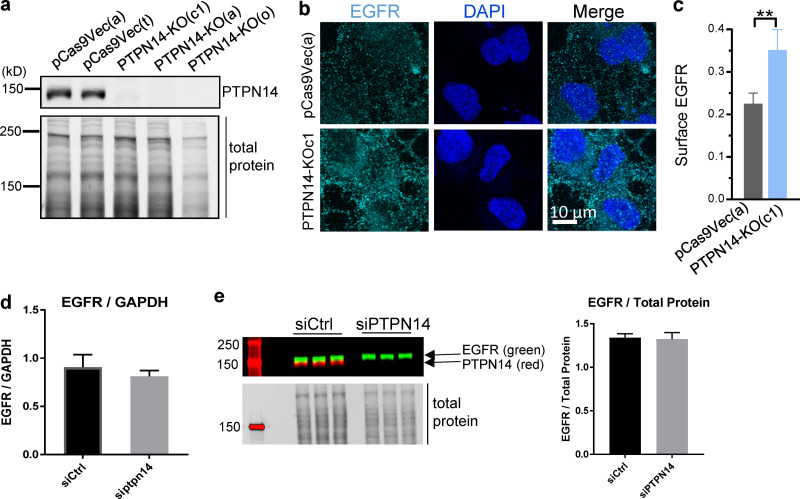
Figure S1.
Loss of PTPN14 enhances cell surface expression of EGFR but not EGFR transcript or total protein. (a) Representative Western blot showing loss of PTPN14 in three independent PTPN14-KO BT-549 cell clones. (b and c) Cell surface EGFR measured by cell surface staining of EGFR sequentially labeled with mouse EGFR-ECD Ab followed by anti-mouse–Alexa Fluor 594 secondary Ab (false-colored green), showing representative confocal image (b) and quantitation of surface EGFR (c; mean fluorescence intensity) from confocal images (mean ± SD; n = 2 independent experiments; minimum 85 cells per treatment condition per experiment; **, P < 0.01, two-tailed Student’s t test). This is a subset of the data shown in Fig. 2 c. (d) Quantitative RT-PCR showing EGFR mRNA levels, relative to GAPDH (mean ± SD; n = 3). (e) Western blot showing EGFR and PTPN14 protein levels (left) and quantified relative to total protein (right; mean ± SD; n = 3).

