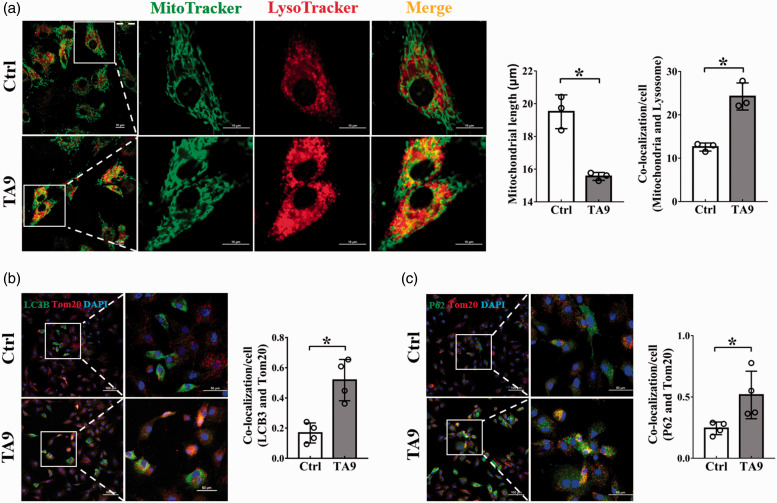
Figure 1.
Effects of mitochondrial fission on mitophagy. BMSCs were treated with 1 μM TA9 for 24 h and visualized by confocal microscopy. (a) The length of mitochondria and the co-localization of mitochondria and lysosomes. Mitochondria in both groups were stained with freshly prepared MitoTracker Green and LysoTracker Deep Red for 20 min. Scale bars represent 10 μm; Original magnification: 1000× (left), 3000× (right). Mitochondrial length and the co-localization of mitochondria and lysosomes were analyzed by ImageJ software. Data were obtained from three separate experiments and more than 10 cells were analyzed in each experiment; (b, c) The co-localization of fluorescently stained autophagy markers (LC3, P62) and mitochondrial marker (Tom20) in BMSCs. Nucleus was stained with DAPI (blue). Scale bars represent 100 μm (left), 50 μm (right); Original magnification: 200× (left), 600× (right). The changes in mean fluorescence intensity (MFI) of LC3B, P62 and Tom20 were analyzed by ImageJ software. Each dot presents one independent experiment. Bar graph values are mean ± SEM. Data were compared using unpaired Student’s t-test. *Significantly different from control (P < 0.05). (A color version of this figure is available in the online journal.)

