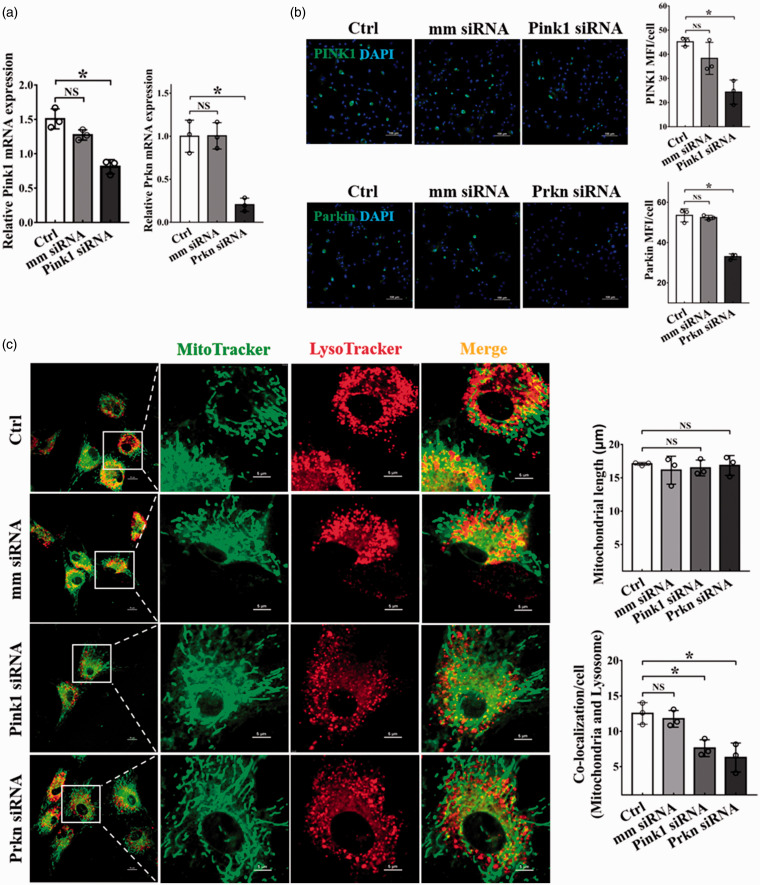
Figure 3.
Decreased mitophagy by Pink1/Prkn gene silencing. BMSCs were transfected with 50 nM Pink1 siRNA or Prkn siRNA for 48 h, followed by qRT-PCR analyzation and immunofluorescence staining. (a) qRT-PCR determination of the mRNA expression of Pink1 and Prkn. Three independent experiments were carried out; (b) Representative images of fluorescently stained PINK1 and Parkin (Green), nucleus was stained with DAPI (blue). Scale bars represent 100 μm, original magnification: 200×. The changes in MFI of PINK1 and Parkin were analyzed by ImageJ software. Data were obtained from three independent experiments; (c) The length of mitochondria and the co-localization of mitochondria and lysosomes. Scale bars represent 10 μm (left), 5 μm (right); Original magnification: 1000× (left), 4000× (right). Images were analyzed by ImageJ software. Data were obtained from three independent experiments and more than 10 cells were analyzed in each experiment. Bar graph values are mean ± SEM. Data were compared using one way-ANOVA. *Significantly different from the control group (P < 0.05). (A color version of this figure is available in the online journal.)

