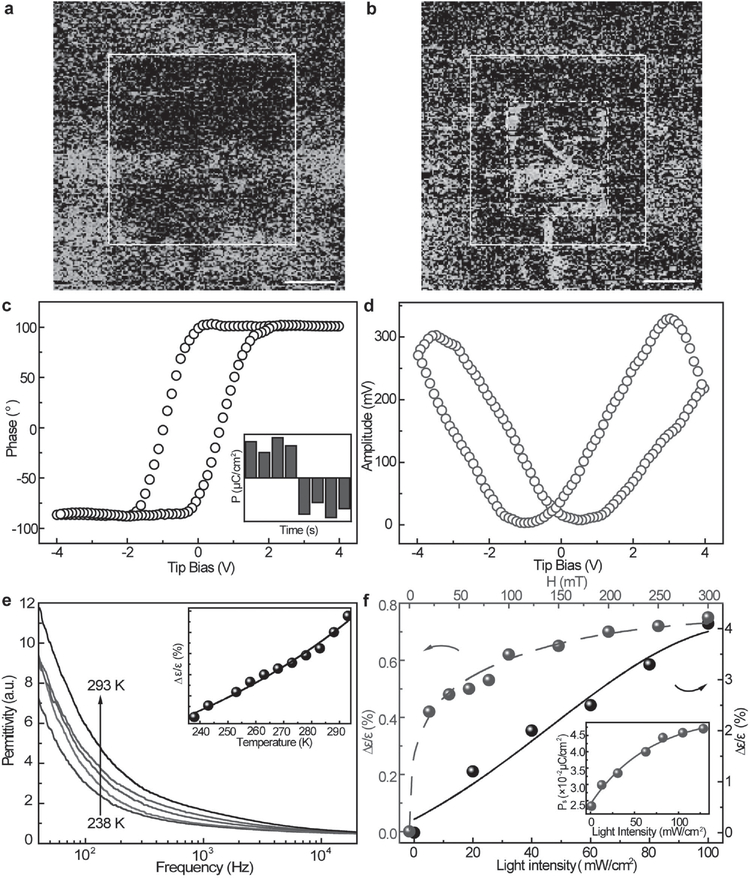
Figure 3.
Ferroelectric and dielectric properties of TCCTs. a,b) Piezoelectric force microscopy image. The square in the center is the polarized area under a voltage of 54 and −72 kV cm−1, respectively. The scale bar is 5 μm. c,d) The phase and amplitude hysteresis loop for piezoelectric response. The inset in (c) is the PUND polarization measurement of TCCTs. e) Frequency-dependent permittivity at different temperatures. The inset is the temperature-dependent permittivity at 100 Hz. f) Magnetic-field and light-intensity-dependent permittivity change. The inset is the light-intensity-dependent polarization value change.

