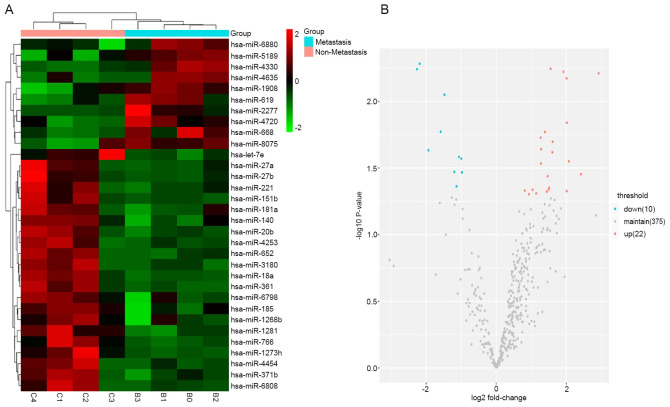
Figure 2.
Microarray analysis of exosomal miRNAs differentially expressed in plasma samples from patients with metastatic and non-metastatic HCC. (A) Heat map of the differential expression of exosomal miRNAs from patients with metastatic and non-metastatic HCC. Each column represents an individual sample and each row represents a single miRNA. The expression levels of each miRNA in a single sample is depicted according to the color scale. Red represents high expression levels, whereas green represents low expression levels. (B) Volcano plot of the association between the logarithm of the fold change on the x-axis and log of P-value between patients with metastatic and non-metastatic HCC on the y-axis. Red represents miRNAs with expression changes of >1.2 from the remaining miRNAs while blue represents miRNAs with expression changes of <-1.2 fold from the remaining miRNAs. HCC, hepatocellular carcinoma; miRNA/miR, microRNA.

