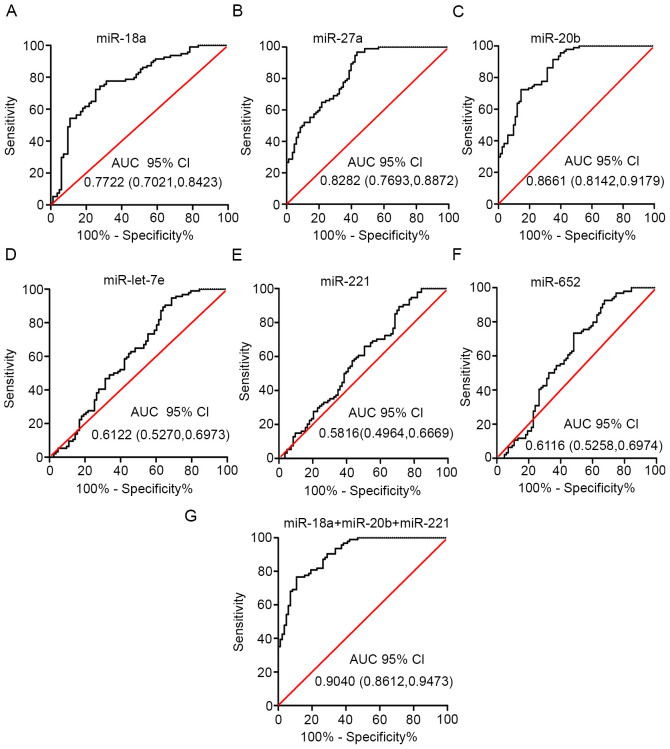
Figure 5.
Plasma exosome miRNA score performance. Receiver operating characteristic curves were presented for (A) miR-18a, (B) miR-27a, (C) miR-20b, (D) miR-let-7e, (E) miR-221, (F) miR-652 and (G) for the combination of miR-18a, miR-20b and miR-221. The AUC with 95% CI was used to evaluate the levels of discrimination. 95% CI, 95% confidence interval; AUC, area under the curve; miRNA/miR, microRNA.

