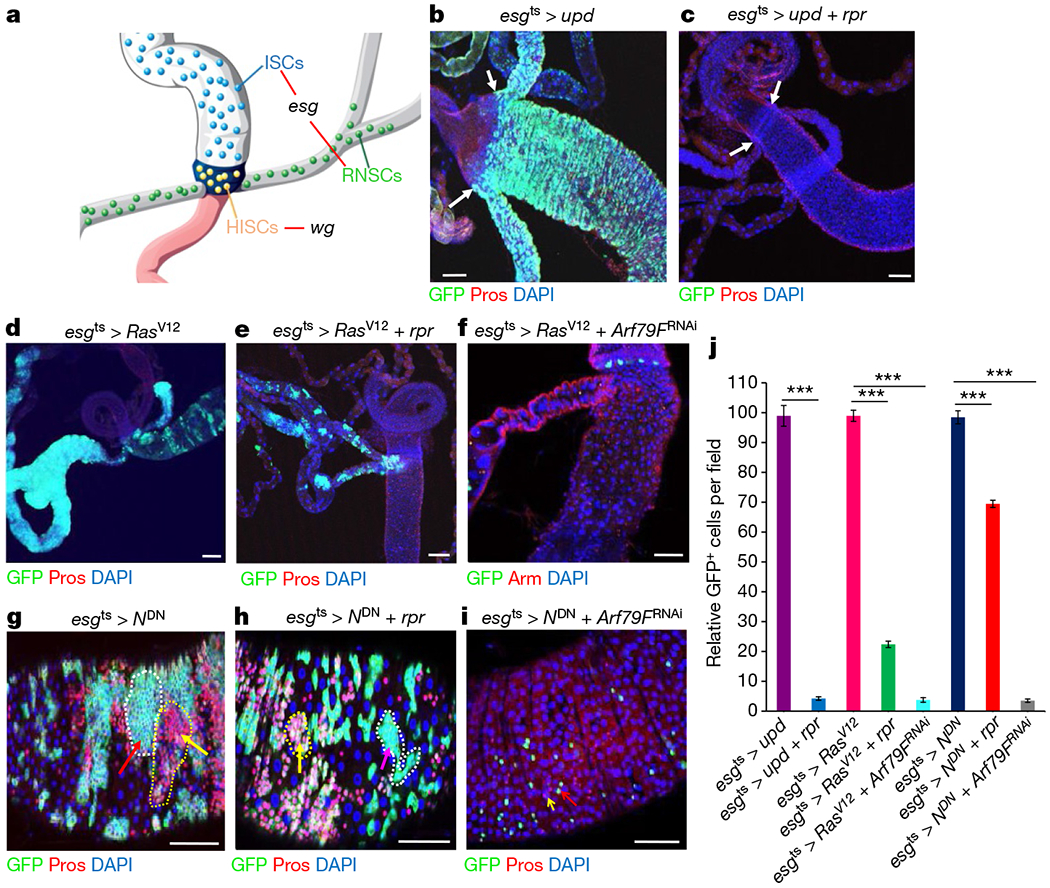
Figure 1 |. Activation of proliferation accelerates apoptotic cell death of hyperplastic stem cells but fails to completely eliminate neoplastic stem cells.

a, Diagram of three types of stem cells near the hindgut–midgut junction, and the cells in which esg–Gal4 (esg) and wg–Gal4 (wg) were expressed. b–i, Representative images of the posterior midguts of flies with the indicated phenotypes. b, esgts > upd, 29 °C, 4 d (n = 33). c, esgts > upd + rpr, 29 °C, 4 d (n = 35). d, esgts > RasV12, 29 °C, 7 d (n = 34). e, esgts > RasV12 + rpr, 29°C, 7 d (n = 29). f, esgts > RasV12 + Arf79FRNAi, 29 °C, 7 d (n = 35). g, esgts > NDN, 29 °C, 7 d (n = 24). h, esgts > NDN + rpr, 29 °C, 7 d (n = 29). i, esgts > NDN + Arf79FRNAi, 29 °C,7 d (n = 38). j, Quantification of GFP+ cells from midguts isolated from flies with the indicated genotypes. Data are represented as mean ± s.e.m. Statistical significance determined by Student’s t-test, ***P < 0.0001. The posterior midguts of flies with the indicated genotypes were dissected, stained with the GFP and Prospero (Pros) antibodies and analysed by confocal microscopy. White arrows in b and c point to the hindgut–midgut junction. g, h, Red arrows with white dotted lines point to clusters of ISCs enteroblasts and yellow arrows with yellow dotted lines point to clusters of enteroendocrine cells. i, Red and yellow arrows point to remaining ISCs/enteroblasts, and enteroendocrine cells, respectively. Scale bars in b–i, 10 μm.
