
Figure 3 |. Knockdown of components of the COPI–Arf79F–β-oxidation pathway kill stem cells through necrosis.
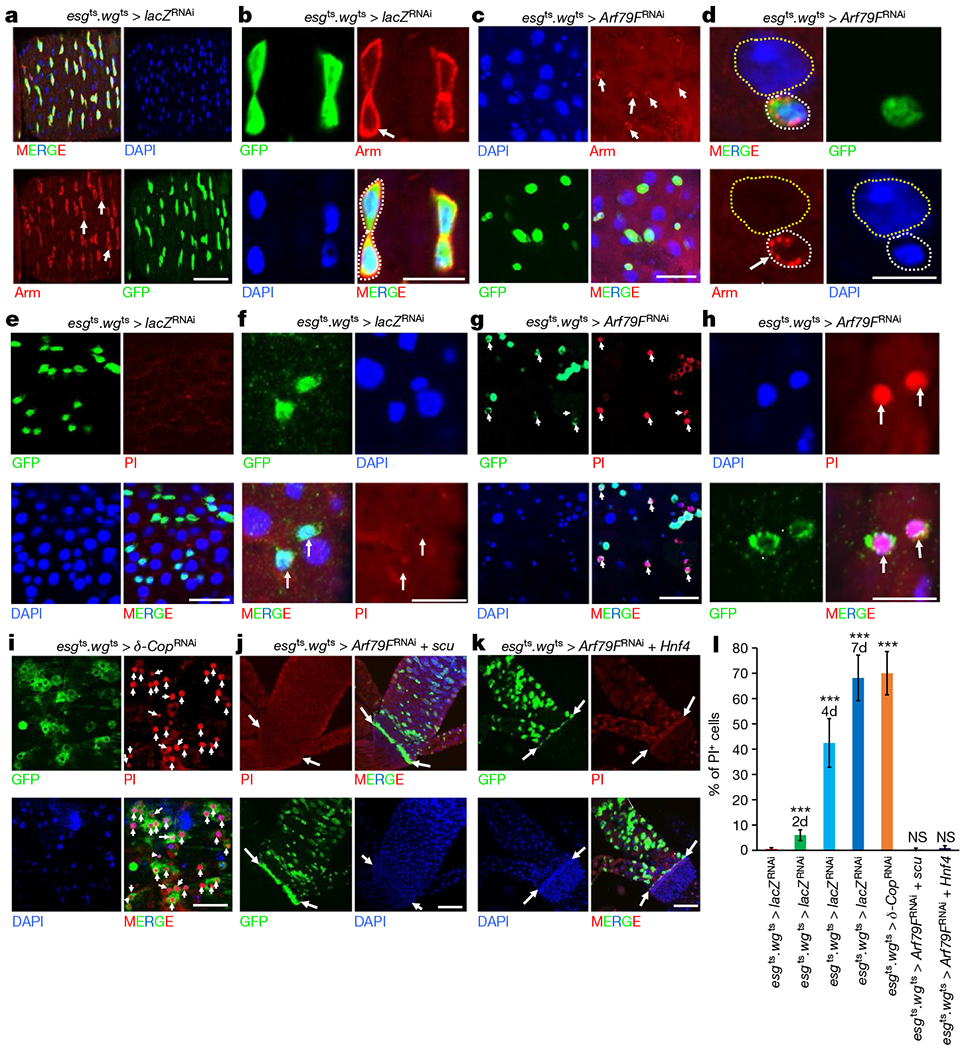
The genotypes of the flies in each panel were: a, b, e, f, esgts wgts > lacZRNAi, 29 °C, 4 d (n = 32). c, d, g, h, esgts wgts > Arf79FRNAi, 29 °C, 4 d (n = 28). i, esgts wgts > δ-CopRNAi, 29 °C, 4 d (n = 30). j, esgts wgts > Arf79FRNAi + scu, 29 °C, 4 d (n = 28). k, esgts wgts > Arf79FRNAi + Hnf4, 29 °C, 4 d (n = 30). l, Quantification of PI+ cells from midguts isolated from flies with the indicated genotypes. Data are represented as mean ± s.d. Statistical significance determined by Student’s t-test, ***P < 0.0001; NS, not significant (P > 0.05). The posterior midguts of flies with the indicated genotypes were dissected, stained with GFP and Armadillo (Arm) antibodies or indicated reagents, and analysed by confocal microscopy. White arrows in a–i point to esg-GFP+ cells and in j–k point to the hindgut–midgut junction. White dotted lines in d outline ISCs/enteroblasts, yellow dotted lines outline enterocytes. Scale bars in a–k, 10 μm.