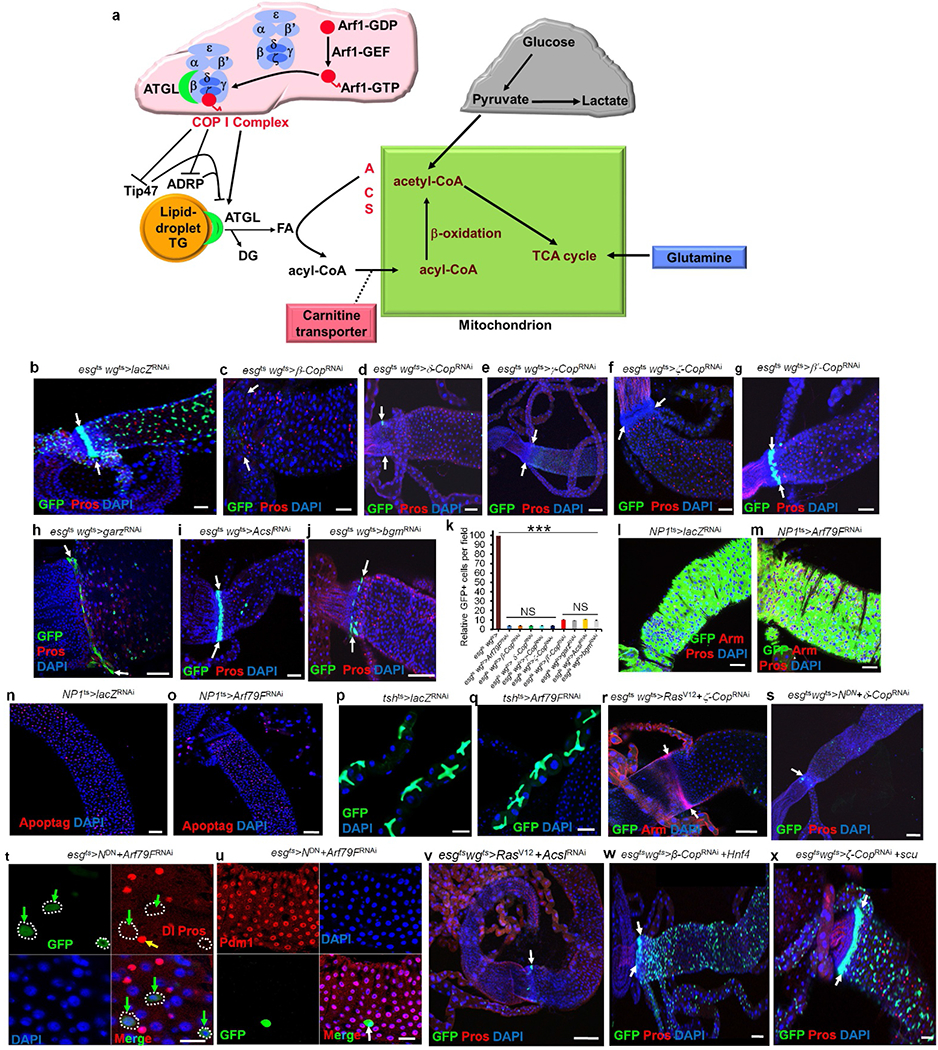
Extended Data Figure 2 |. The COPI–Arf1 complex regulates stem but not differentiated cell survival.

a, The COPI–lipolysis–β-oxidation pathway. The COPI–Arf1 complex controls lipid homeostasis by regulating adipocyte differentiation-related protein (ADRP), tailinteracting protein of 47kDa (Tip47) and adipocyte triglyceride lipase (ATGL)15. Triglycerides (TG), diglyceride (DG), fatty acid (FA), Acyl-CoA synthetase (ACS). b–j, The COPI–Arf1 complex regulates stem cell survival. The genotypes of the flies in each panel were: b, esgts wgts > lacZRNAi, 29 °C, 7 d (n = 38). c, esgts wgts > β-CopRNAi, 29 °C, 7 d (n = 23). d, esgts wgts > δ-CopRNAi, 29 °C, 7 d (n = 32). e, esgts wgts > γ-CopRNAi, 29 °C, 7 d (n = 27). f, esgts wgts > ζ-CopRNAi, 29 °C, 7 d (n = 31). g, esgts wgts > β’-CopRNAi, 29 °C, 7 d (n = 29). h, esgts wgts > garzRNAi, 29 °C, 7 d (n = 27). i, esgts wgts > AcslRNAi, 29 °C, 7 d (n = 32). j, esgts wgts >bgmRNAi, 29 °C, 7 d (n = 25). k, Quantification of GFP+ cells in the indicated panels. Data show mean ± s.e.m. Statistical significance was determined by Student’s t-test, ***P < 0.0001. NS, not significant (P >0.05). l–q Knockdown of the COPI–Arf79F complex did not kill differentiated cells. The genotypes of the flies in each panel were: l, n, NP1ts > lacZRNAi, 29 °C, 7 d (n = 25). m, o, NP1ts > Arf79FRNAi, 29 °C, 7 d (n = 32). p, tshts >lacZRNAi, 29 °C, 7 d (n = 22). q, tshts > Arf79FRNAi, 29 °C, 7 d (n = 25). r, esgts wgts > RasV12 + ζ-CopRNAi, 29 °C, 7 d (n = 27). s, esgts wgts > NDN + δ-CopRNAi, 29 °C, 7 d (n = 30). t, u, esgts > NDN + Arf79FRNAi, 29 °C, 7 d (n = 40). v, esgts wgts > RasV12 + AcslRNAi, 29 °C, 7 d. (w) esgts wgts > β-CopRNAi + Hnf4, 29 °C, 7 d. x, esgts wgts > ζ-CopRNAi + scu, 29 °C, 7 d. White arrows in b–j and r, s, w, x, point to the hindgut–midgut junction. Yellow arrows point to Pros+ enteroendocrine cells in t; green arrows point to Dl+ ISCs in t, and a white arrow points to a remaining GFP+ stem cell in u. Scale bars in b–j and l–x, 10 μm.
