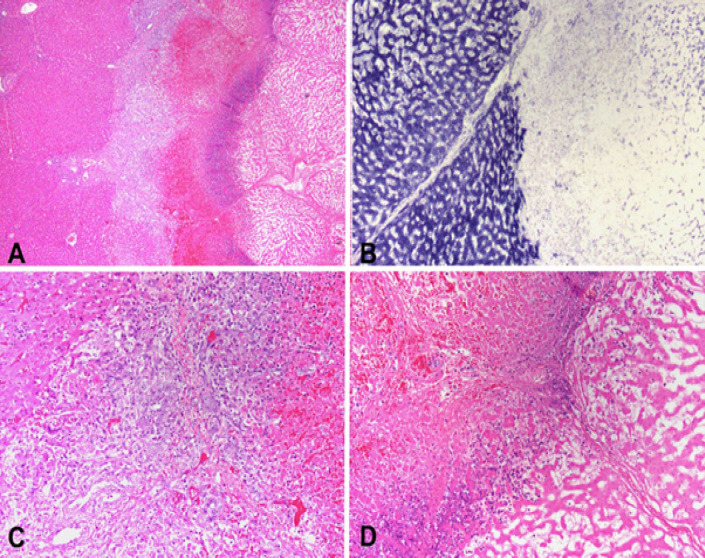
Figure 3.
A. Periphery of an ablated zone demonstrating from left to right: viable liver, inflammatory response, hemorrhagic necrosis, nuclear dust and necrotic ablated liver (H and E stain). B. NADH staining showing viable liver on the left and necrotic ablated liver on the right. C. High power of viable liver on the left followed by bile duct reaction, lymphocytes, plasma cells, eosinophils, and hemorrhagic necrosis (H and E stain). D. High power showing a rim of nuclear dust and coagulative necrosis on the right (H and E stain)

