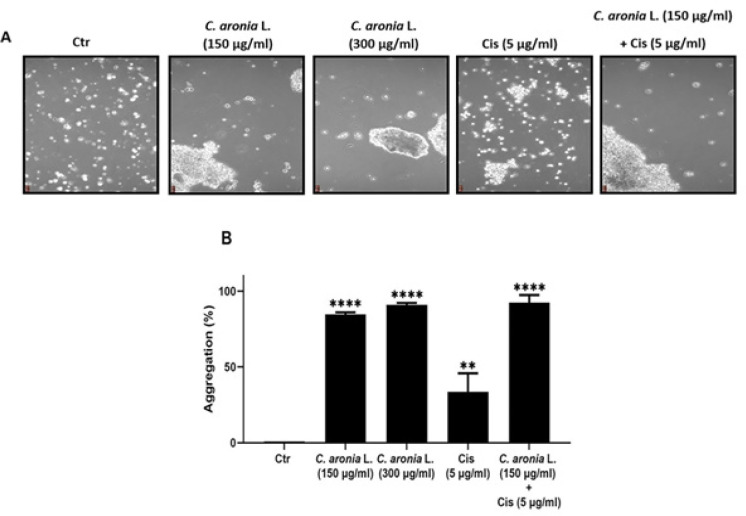
Figure 5.
Effect of C. aronia L. in Aggregation of Human Lung Cancer Cell Line (A549). (A) A549 were treated for 1 hr with the indicated concentrations of Cis and C. aronia L. separately and with the combination of Cis and C. aronia L. A549 cells were photographed with light microscope at x100 magnification. (B) The histogram represents the percentage of aggregation of A549 cells in the presence of C. aronia L. extract and/or Cis. The % of aggregation is calculated as described in material and methods. Data are presented as the mean ± SEM for three independent experiments (**p<0.01, ****p<0.0001)

