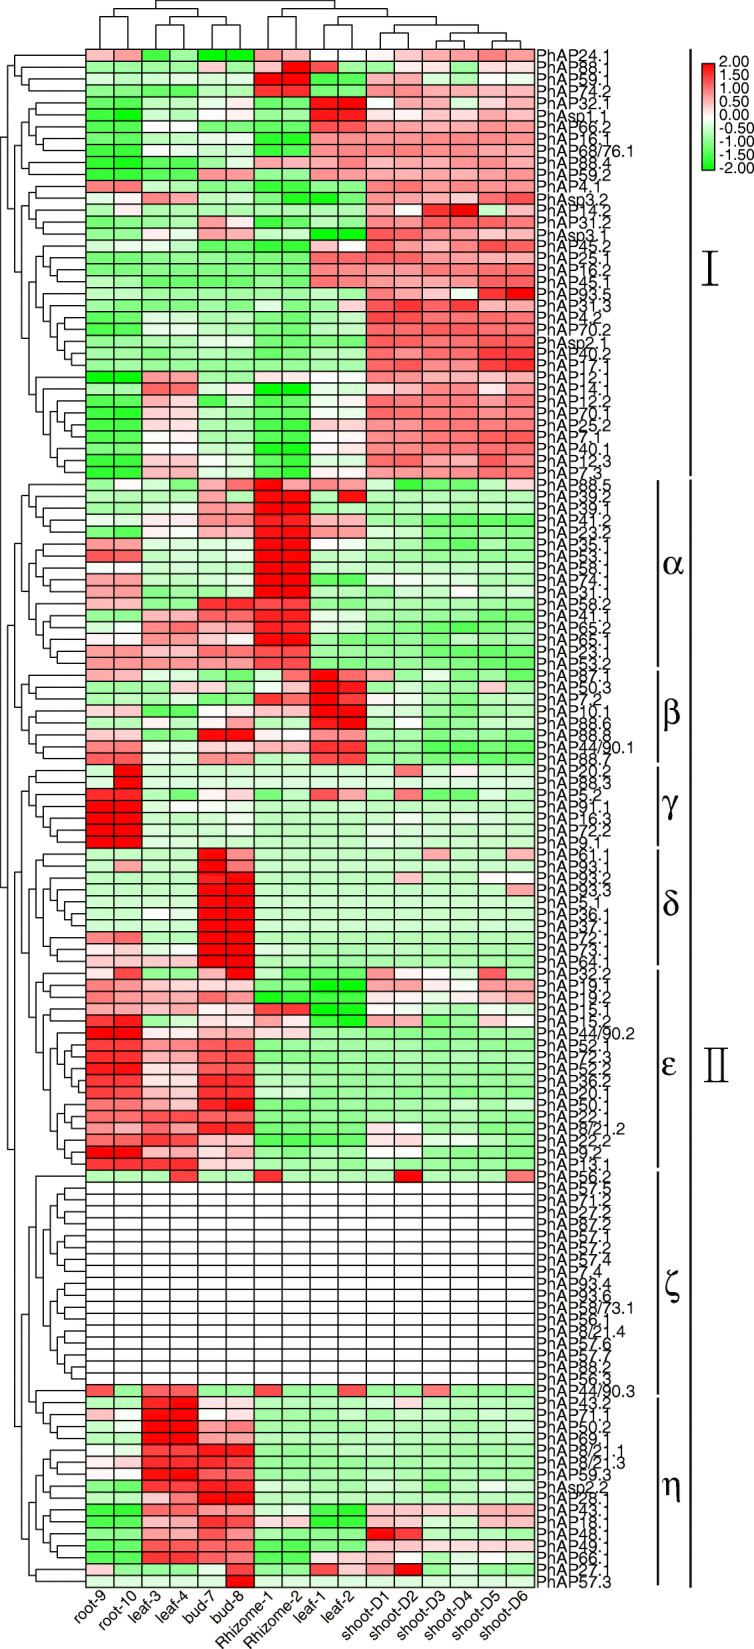
Fig. 7.

Expression patterns of PhAPs in different tissues of moso bamboo. The expression profiles of the 129 PhAPs is displayed by hierarchical clustering. The color bar in the upper-right corner indicates log2-based transcripts per million reads (TPM). Roots 9 and 10 represent 2 biological replicates of new roots with lateral roots, leaves 1 and 2 represent 2 biological replicates of leaf blades, leaves 3 and 4 represent 2 biological replicates of leaf sheaths, rhizomes 1 and 2 represent 2 replicates of rhizomes, and buds 1 and 2 represent 2 replicates of buds on rhizomes. Shoots D1 and D2, D3 and D4 and D5 and D6 represent 2 replicates of the top, middle and basal portions of the 6.7 m high shoot. The TPM value was listed in Table S4
