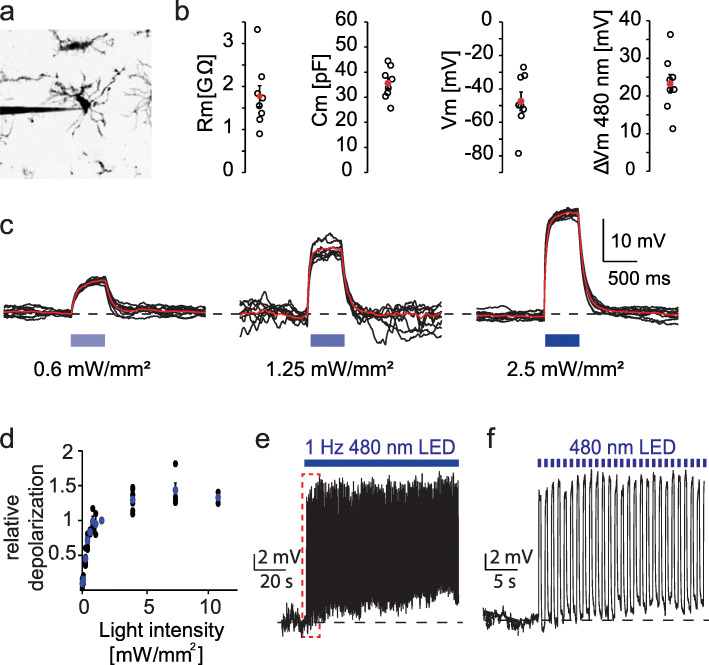
Fig. 2.
Optogenetic microglia depolarization using the Channelrhodopsin variant ChETA. a Two-photon maximum projection of a microglia patched in organotypic slice culture. Contrast inversion for better visibility. b Microglia cell properties; from left to right: Membrane resistance, cell capacitance, membrane potential, and change in membrane potential upon illumination with 1 mW/mm2 480 nm light. Black circles: n = 9 microglia, 5 slices; red dot: mean ± SEM. c Light-induced membrane depolarizations in microglia. Black: individual sweeps (n = 17 sweeps), red: peristimulus time histogram (PSTH) of seven consecutive sweeps with the same light intensity. d Relative depolarization of microglia membrane potential in response to 480 nm light. Blue dots: mean ± SEM. e Voltage-clamp recording of a microglia cell with repetitive 1 Hz 480 nm light stimulation at 1 mW/mm2 (n = 7 microglia, 3 slices, female, DIV 12–20). f Enlargement of red dotted box in (e)

