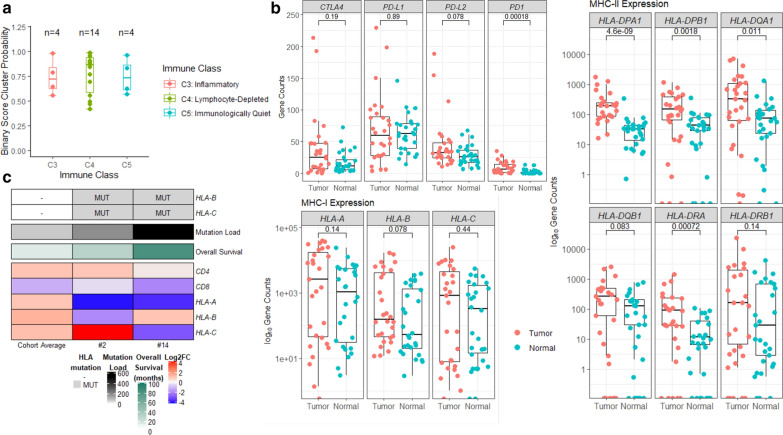
Fig. 6.
Immunological profiling and immunomodulatory gene expression. a Distribution of immune subtypes among tumors in our cohort, defined by RNA sequencing immunologic gene expression analysis following the classification scheme described by Thorsson et al. [69] and using a binary cluster probability threshold of at least 0.4 for sufficiently valid classification. Each dot represents the clustering probability (y-axis), colored by immune class (inflammatory or “C3” [red], lymphocyte-depleted or “C4” [green], immunologically quiet or “C5” [blue]). b Expression of immunomodulatory genes: (log10) normalized gene counts are plot for each tumor and normal, differential expression are tested by Wilcox Rank Sum test and p value reported. c Profile of overall tumor mutation load and expression of immunomodulatory genes in two patients (#2 and 14) with co-occurring HLA-B and HLA-C mutations, compared to (and color-coded against) the cohort average (n = 28)

