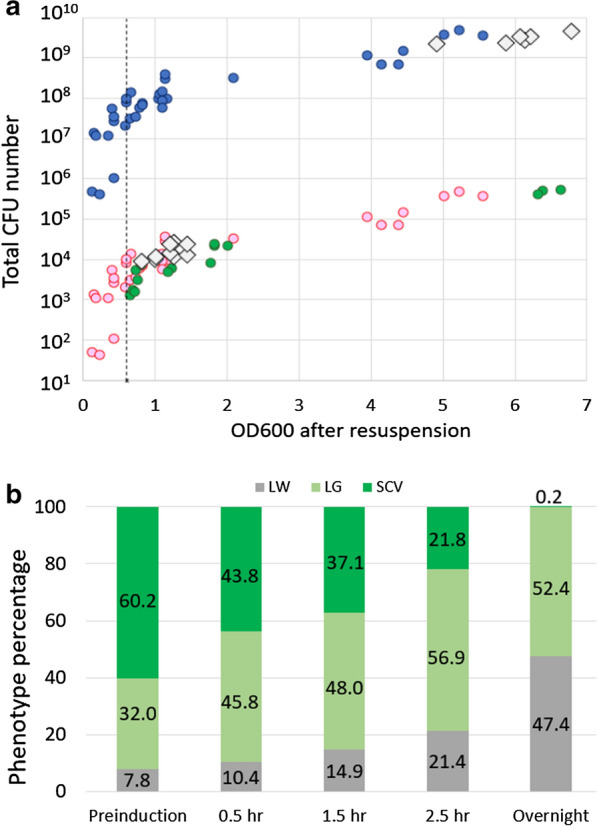
Fig. 4.

Effect of protein over-expression on the phenotype population in solution upon protein induction with 0.4 mM IPTG. a The change in total CFU number (LW + LG + SCV) with increasing OD600. Values above OD600 > 3.5 are overnight samples. Blue circles indicate the CFU numbers from BL21(DE3) transformed with H6msfGFP and plated on LB agar plus kanamycin. The red circles are the predicted 99.99% decrease in CFU numbers (Fig. 2) as a result of the induction of exogenous protein over-expression. The green spheres are the measured CFU counts due to exogenous protein over-expression induction on LB agar plates only. Clear diamonds are the measured CFU numbers due to exogenous protein over-expression (protein induction) when 0.4 mM IPTG is added to the liquid medium. The dashed line represents the recommended protein induction OD600 value of 0.6. All measured points are an average of duplicate plating. b Percentage of LW, LG and SCV phenotypes observed during the protein over-expression experiment. Preinduction samples were taken at an average OD600 of 0.5 (Additional file 1: Fig. S4b). Protein over-expression was started approximately seven minutes later with the addition of 0.4 mM IPTG. The remaining samples were taken at the indicated times after the start of protein over-expression. Overnight represented ~ 14.5 h after the start of exogenous protein over-expression. The phenotype percentages for each of the sampled points were generated from CFU counts based on six individual cell cultures and the averaging of duplicate plates for each individual point
