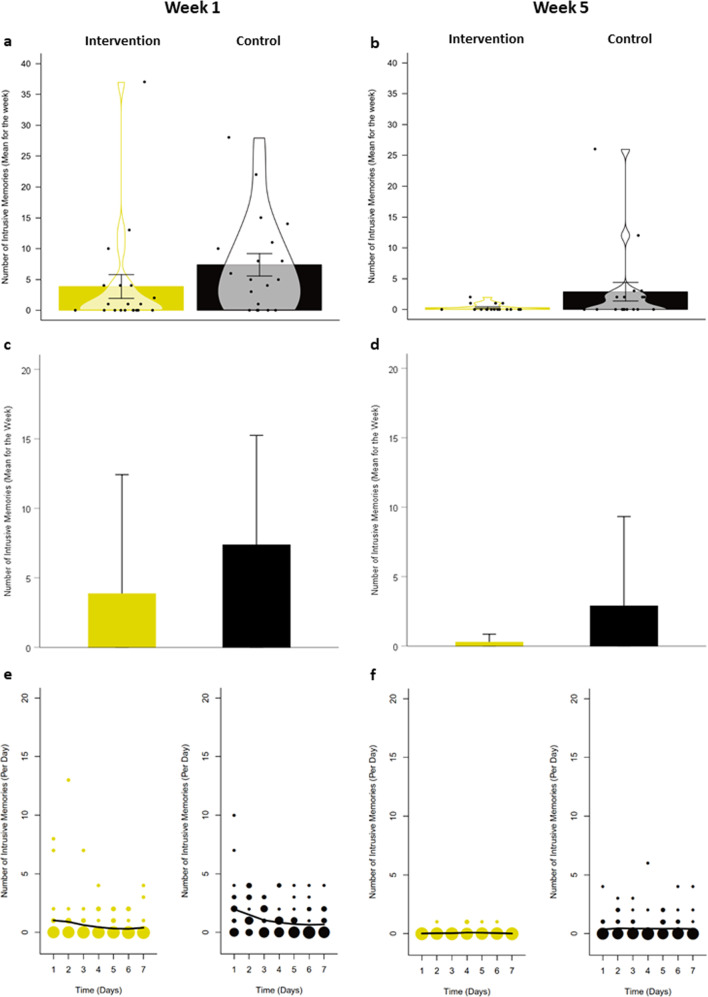
Fig. 2. Number of intrusive memories of the traumatic event in the intervention and active control conditions.
Intervention = cognitive task (trauma memory reminder cue plus Tetris computer game play using mental rotation); Active control condition = attention placebo task (listening to podcast). a Violin plots displaying mean number of intrusive memories recorded in a daily diary during week 1 after completing the intervention/control procedure following a traumatic event. Error bars depict standard errors. Points depict the total number of intrusive memories (per week) of each participant. Violins depict smoothed density. Plots were created with the pirate plot function of the ‘yarrr’ package (Version 0.1.5)50 in R42. b Violin plots displaying mean number of intrusive memories recorded in a daily diary during week 5 (as above). c Bar graphs displaying mean number of intrusive memories recorded in a daily diary during week 1 after completing the intervention/control procedure following a traumatic event. Error bars depict standard deviations (for comparison with Iyadurai et al.3, Fig. 2). d Bar graphs displaying mean number of intrusive memories recorded in a daily diary during week 5 (as above). e Frequency scattergraphs displaying the time course of the number of intrusive memories recorded in a diary during week 1 after completing the intervention/control procedure following a traumatic event. The size of the circles represents the number of participants who reported the indicated number of intrusive memories on that particular day, scaled separately for each condition (see also Supplementary Information for Fig. 2e). f Frequency scattergraphs displaying the time course of the number of intrusive memories recorded in a diary during week 5 (as above).

